

For a group operating across several legal entities, countries or currencies, consolidated reporting often looks deceptively simple. Add the subsidiaries together, translate foreign currencies, eliminate intercompany activity, and publish the group result.
In practice, each of those verbs hides a governance decision.
Which exchange rate applies to revenue? Which rate applies to the balance sheet? What happens when one subsidiary closes on a different calendar? How should an intercompany service charge be matched when one entity books it in March and the other in April? Does “revenue” mean the same thing in every operating company? And when the CEO sees a regional margin movement, can the finance team explain whether it came from operating performance, currency movement, allocation changes or accounting adjustments?
That is why multi-entity reporting is not primarily a dashboard problem. It is a data-modeling, finance-governance and reconciliation problem that eventually produces a dashboard.
Organizations that get this right create a reporting layer in which local detail remains traceable while group-level numbers are consistently defined. Organizations that skip that foundation often spend every reporting cycle reconciling spreadsheets that were never designed to agree.
This guide explains how to design multi-entity financial reporting so that management can trust the consolidated view without losing the ability to investigate the entities underneath it.
1. Start by separating legal reporting from management reporting
The first design decision is to distinguish two requirements that are frequently mixed together.
Statutory or legal-entity reporting answers questions about a specific company: its local books, local currency, chart of accounts, accounting rules and legal reporting obligations.
Management reporting answers different questions: How is the group performing? Which country is growing? Which business unit is contributing margin? What is the consolidated cash position? How do actuals compare with budget?
The same transaction may need to appear differently in these two views. A local entity may use an account structure that is perfectly appropriate for statutory reporting but inconsistent with the group’s management hierarchy. A group-level analytics model should therefore preserve the local account and entity attributes while also mapping them to standardized reporting dimensions.
Do not solve inconsistency by destroying local detail. Preserve the source, then create governed mappings on top of it.
A useful consolidated model normally retains at least:
- Legal entity
- Country and region
- Local currency
- Group reporting currency
- Local account and standardized group account
- Business unit, department or cost center
- Customer and vendor where relevant
- Transaction date and reporting period
- Local amount and translated amount
- Source system and source transaction identifier
- Intercompany counterparty where applicable
This structure gives finance the ability to reconcile a consolidated number back to the underlying books.
2. Create a group chart of accounts without forcing every entity onto one ERP
A common assumption is that consolidated reporting requires every subsidiary to use the same ERP and chart of accounts. Standardization can help, but it is not always necessary or economically justified.
The more immediate requirement is a controlled mapping from each local chart of accounts to a common group reporting structure.

For example, three entities might record software costs as “IT subscriptions,” “SaaS expense” and “Technology services.” Management may want all three mapped to a common Software and Technology category while preserving the original accounts for audit and reconciliation.
The mapping should not live inside a dashboard formula. It should be maintained as governed data with an owner, effective dates and a change process.
At minimum, the mapping should answer:
- Which local account maps to which group account?
- When did that mapping become effective?
- Is the mapping one-to-one or does it depend on another dimension?
- Who owns the definition?
- What happens to unmapped accounts?
Unmapped transactions should be visible as an exception. Silently assigning them to “Other” makes a dashboard look complete while hiding a control failure.
Actiknow’s Business Intelligence services cover data integration, solution architecture, modeling and dashboard implementation, which are the technical layers typically required once these finance definitions are established.
3. Treat currency conversion as accounting logic, not a display setting
Currency translation is one of the easiest places to create plausible but incorrect consolidated numbers.
A BI tool can convert GBP, EUR or INR to USD with a formula. That does not mean the formula represents the group’s approved financial reporting policy.
Different financial statement elements may require different translation approaches. Income statement activity may use periodic average rates, while balance-sheet balances may use period-end rates. Equity and historical transactions can require different treatment depending on the accounting framework and reporting purpose.

The analytics team should not invent these rules. Finance should define them, and the data model should implement them transparently.
A robust FX design usually includes:
- Source currency
- Target reporting currency
- Rate type
- Effective date or reporting period
- Exchange rate
- Source of the approved rate
- Local-currency amount
- Reporting-currency amount
If management also wants a constant-currency view, store or calculate that separately from reported currency. Constant-currency analysis is useful because it helps distinguish operational growth from exchange-rate movement, but it should never be confused with the official translated result.
Executives should be able to answer three different questions:
- What did the entity report in local currency?
- What is that amount in the group’s reporting currency under the approved FX policy?
- How would performance compare if currency movements were held constant?
Those are three legitimate views, not three competing answers.
4. Make intercompany activity identifiable before trying to eliminate it
Intercompany elimination is often described as a consolidation calculation. The harder problem is identifying the matching transactions reliably.
Consider a parent company that charges a subsidiary for shared technology services. One entity records intercompany revenue. The other records an intercompany expense. At group level, both need to be eliminated.
Problems arise when:
- Counterparty codes are missing or inconsistent
- Entities book transactions in different periods
- One side records a net amount and the other a gross amount
- Currency translation creates small differences
- Invoices are partially settled
- Manual journals do not carry an intercompany identifier
The reporting model should therefore include an explicit intercompany dimension and, where possible, a counterparty entity on both sides of the transaction.
A practical reconciliation process classifies intercompany balances into matched, timing difference, FX difference, amount difference and unmatched. Finance can then investigate exceptions instead of manually comparing entire ledgers.
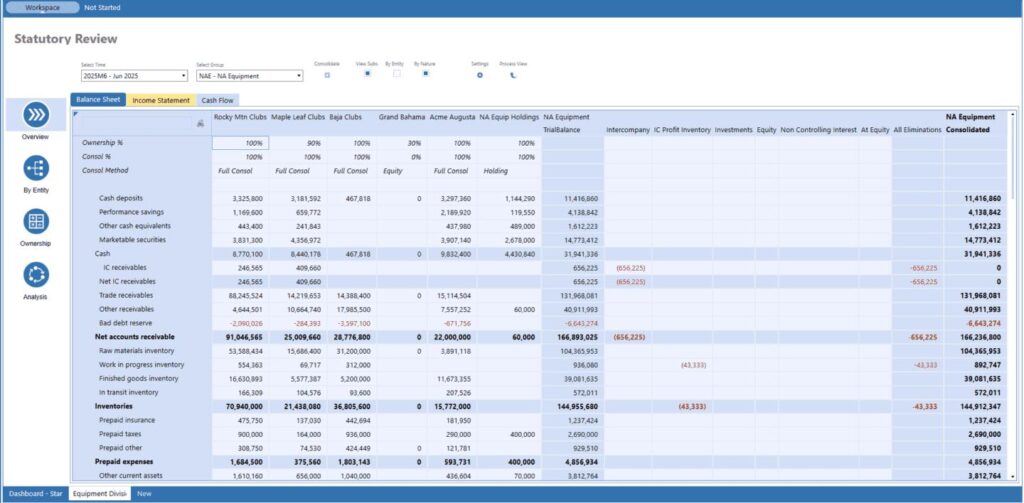
The important management principle is simple: elimination logic should not make discrepancies disappear. It should expose them before the consolidated number is finalized.
5. Standardize the reporting calendar
Multi-country organizations often inherit different fiscal calendars, local holidays, accounting close dates and operational definitions of a “month.”
The reporting layer needs a canonical group calendar.
Every transaction or balance should be mapped to both its source accounting period and the corresponding group reporting period. If a business uses a 4-4-5 calendar, a non-calendar fiscal year or local periods that differ from the parent, that relationship should be explicit in a date dimension rather than reconstructed separately in each report.
The same principle applies to weekly and daily reporting. “Week 1” is meaningless unless the organization has agreed when weeks begin, how partial weeks are treated and how year boundaries work.
A governed calendar prevents subtle inconsistencies between Finance, Sales and Operations dashboards.
6. Separate source data, transformation logic and presentation
One of the strongest architectural choices for multi-entity reporting is to keep three concerns separate.
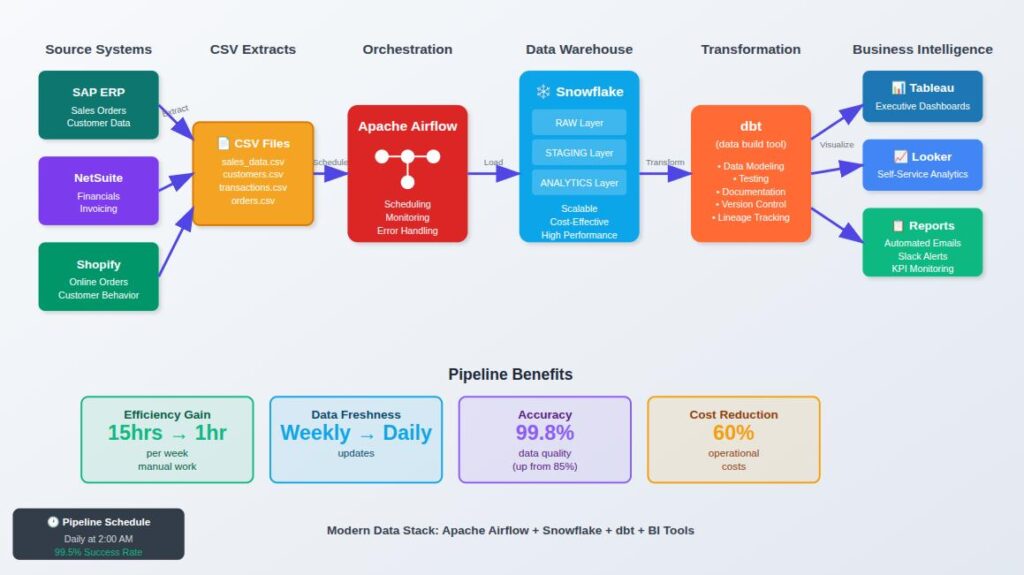
The source layer preserves what each ERP, accounting platform, CRM or operational system actually supplied.
The transformation layer standardizes entities, accounts, currencies, calendars and intercompany relationships.
The presentation layer exposes certified metrics and dimensions to Power BI, Tableau, Looker Studio, Excel or another reporting interface.
This separation matters because group reporting logic changes. An acquisition introduces a new entity. Finance changes an account mapping. A region is reorganized. A new reporting currency is required. If those rules are buried in individual workbooks and dashboards, every change becomes a reporting project.
A governed data layer allows the rule to be changed once and consumed consistently across reports.
Where source systems need to be connected or a centralized database or data lake is required, Actiknow’s custom solutions capabilities include API-based integrations and database/data-lake setup. The specific architecture should still be chosen according to the organization’s systems, volumes, controls and reporting requirements.
7. Build the consolidation model around traceability
Every consolidated figure should be explainable through a drill path.
A group operating-expense number, for example, should be traceable from:
- Group total
- Region
- Country
- Legal entity
- Group account
- Local account
- Transaction or journal
- Source system
Not every executive dashboard needs to expose the final transaction-level drill. But the underlying model should make reconciliation possible.
Traceability is particularly important during month-end close because the question is rarely just “What is the number?” The real questions are “Why did it change?” and “Can we prove where it came from?”
For each material metric, document:
- Definition
- Owner
- Source systems
- Transformation rules
- Currency rule
- Elimination treatment
- Reporting grain
- Refresh frequency
- Reconciliation control
This metric documentation becomes part of the reporting control environment.
8. Design for acquisitions and new entities
A consolidation architecture should assume the organizational structure will change.
When a new company is acquired, the ideal onboarding process is not to redesign the executive dashboard. It is to connect the new source, map its entities and accounts, assign its currency and calendar, establish intercompany relationships, validate opening balances and run reconciliation tests.
That requires entity mappings to be data-driven rather than hard-coded throughout SQL and dashboard formulas.
The same principle applies to reorganizations. If a legal entity moves from one management region to another, the model may need effective-dated organizational hierarchies so historical reporting can either preserve the structure that existed at the time or restate history under the new structure, depending on management policy.
Both views can be valid. The important point is to define which one a report uses.
9. Reconcile before you visualize
A beautiful consolidated dashboard is not evidence that the consolidation is correct.
Before executive rollout, finance and data teams should perform structured reconciliation at several levels.
Source reconciliation: Do extracted totals match each source ledger for the same period and filters?
Mapping reconciliation: Are all accounts, entities and currencies mapped? Are there unexpected defaults?
Translation reconciliation: Are approved rates applied to the correct periods and rate types?
Intercompany reconciliation: Do reciprocal balances match within defined tolerances before elimination?
Consolidation reconciliation: Does the final group result equal the sum of translated entities plus approved consolidation adjustments and eliminations?
Report reconciliation: Do dashboard totals match the certified consolidated dataset?
These checks should be repeatable. A control that requires someone to manually rebuild a spreadsheet every month is a process, but it is not a scalable data control.
10. Decide what executives should actually see
The executive view should not replicate the consolidation workbook. Its purpose is to explain performance.
A useful group dashboard may include:
- Revenue, gross margin, EBITDA or other approved financial measures
- Actual versus budget and prior period
- Local-currency and reporting-currency views where useful
- Constant-currency variance where management uses it
- Region, country and entity contribution
- Material FX impact
- Intercompany reconciliation exceptions
- Close status or data freshness
- Major movements requiring commentary
The exact measures depend on the business. A professional-services group, retailer and manufacturer will not have the same executive KPI set.

What should remain consistent is the chain from the executive metric to its governed definition and reconciled source.
11. Define a close and refresh operating model
Multi-entity reporting is not finished when the pipeline runs.
Someone must own the monthly operating process.
A practical sequence might be:
- Entities close local books.
- Source data is extracted or refreshed.
- Automated completeness and mapping checks run.
- FX rates are approved and applied.
- Intercompany exceptions are reconciled.
- Consolidation adjustments are posted or loaded.
- Finance signs off the certified dataset.
- Executive reports refresh from the certified layer.
During the month, management dashboards can refresh more frequently using preliminary data, but the interface should make the data status clear. “Latest” and “closed” are not synonyms.
12. Use exceptions to make the process scalable
As entity count grows, finance should not have to inspect every record.
The system should surface exceptions such as:
- Unmapped accounts
- Missing entity or counterparty codes
- Missing FX rates
- Intercompany mismatches above tolerance
- Unexpected currency combinations
- Late entity submissions
- Material movements versus prior period
- Differences between source totals and loaded totals
This changes the operating model from manually proving everything is correct to investigating the items that failed defined controls.
That is a much more scalable way to manage a growing group.
A Practical Implementation Roadmap
Phase 1: Define the reporting contract
Agree the group chart of accounts, entity hierarchy, reporting currency, FX policies, fiscal calendar, intercompany rules, KPI definitions and close ownership. Document disagreements rather than letting developers resolve them implicitly.
Phase 2: Inventory and profile the sources
Identify every ERP, accounting system, spreadsheet and operational source. Record data owners, extraction methods, historical coverage, identifiers, currencies and known quality issues.
Phase 3: Build canonical dimensions
Create governed entity, account, currency, date, organizational and counterparty dimensions. Make mappings visible and maintainable.
Phase 4: Build and test the financial model
Load source facts, preserve local values, implement approved translations, apply group mappings and create intercompany matching and elimination logic.
Phase 5: Reconcile with Finance
Run parallel reporting for representative periods. Investigate differences until the team can explain them. Do not set an arbitrary percentage tolerance for material financial discrepancies unless Finance has explicitly approved it.
Phase 6: Publish certified reporting
Expose a controlled dataset or semantic model to the BI layer. Build executive views from certified definitions rather than recreating finance logic in visuals.
Phase 7: Operationalize
Add monitoring, exception reporting, ownership, documentation and change control. Define how a new entity, account, currency or source system will be onboarded.
What Good Multi-Entity Reporting Looks Like
The best test is not whether the consolidated dashboard refreshes quickly. It is whether the organization can answer these questions consistently:
- Can Finance reconcile every material group number to source systems?
- Can management compare entities using standardized definitions?
- Can users distinguish local performance from currency effects?
- Are intercompany mismatches visible before elimination?
- Can a new entity be onboarded without rebuilding every report?
- Can a definition change be implemented centrally?
- Can executives tell whether the data is preliminary or closed?
- Can the team explain a material variance without assembling a new spreadsheet?
If the answer to several of these is no, the organization probably does not have a visualization problem. It has a consolidation-data design problem.
Frequently Asked Questions
What is multi-entity financial reporting?
Multi-entity financial reporting combines financial information from multiple legal entities into a consistent group view. It normally requires standardized account mappings, entity hierarchies, currency translation, reporting calendars, intercompany treatment and reconciliation controls while preserving the ability to trace results back to local records.
Do all subsidiaries need the same ERP for consolidated BI?
No. A common ERP can simplify standardization, but consolidated analytics can also integrate multiple source systems. The critical requirement is a governed common model that maps local entities, accounts, currencies and periods into consistent group definitions.
Should currency conversion happen in Power BI or another dashboard tool?
The presentation tool can technically perform currency calculations, but group translation rules are usually better governed in a reusable data or semantic layer. That prevents separate reports from applying different rates or logic. Finance should define the approved translation policy.
How should intercompany transactions be handled?
Transactions should carry an identifiable intercompany counterparty wherever possible. Reciprocal balances should be matched and exceptions investigated before approved elimination logic is applied. Timing, FX and amount differences should remain visible rather than being silently hidden.
How do you compare entities that use different fiscal calendars?
Create a canonical group calendar and map each entity’s source accounting periods to group reporting periods. Preserve both the source period and group period so local reporting can still be reconciled.
What is constant-currency reporting?
Constant-currency reporting recalculates comparative performance using a consistent exchange-rate basis so management can better isolate operational change from FX movement. It is an analytical view and should be clearly distinguished from official translated financial results.
How often should consolidated dashboards refresh?
Refresh frequency should follow the decision process and source availability. Operational views may refresh daily or more frequently, while certified financial results may follow the formal close. The dashboard should clearly indicate whether data is preliminary, refreshed or closed.
What should be automated first?
Start with repeatable controls that consume finance time or create reporting risk: source extraction, account mapping checks, FX-rate completeness, intercompany matching, source-to-model reconciliation and recurring report refreshes. Automation should make exceptions more visible, not merely make incorrect numbers arrive faster.
Call to Action
If your group reporting still depends on manually combining entity files, rebuilding FX calculations or reconciling competing dashboard totals each month, the first step is not necessarily a new BI tool. It is to define the consolidation rules and data model that the reporting layer should trust.
Actiknow works on Business Intelligence implementations, data integration, modeling, automation and custom data solutions. If you are evaluating how to structure a multi-entity reporting layer around your existing systems, contact Actiknow to discuss the architecture and implementation requirements.