

Business intelligence programs often fail for a surprisingly ordinary reason: organizations try to build too much before they have proved what matters.
The first 90 days of a BI initiative should not be treated as a compressed version of a multi-year data transformation. They should establish a trustworthy foundation, deliver one or two useful outcomes, and create evidence for what to do next. That means resisting the temptation to connect every system, model every metric, or build dashboards for every department at once.
A good 90-day BI roadmap answers four questions. Which decisions are we trying to improve? Which data is required for those decisions? Can the resulting numbers be reconciled to trusted sources? And will the people responsible for those decisions actually use the solution?
This guide lays out a practical approach for executives, CIOs, CTOs, CFOs, data leaders, and operational teams planning a new BI implementation or resetting one that has become too broad.
What Success Should Look Like After 90 Days
The objective is not “BI completed.” Business intelligence is an operating capability, not a one-time installation.
By day 90, a strong implementation should instead have:
- A clearly defined set of business decisions and KPIs in scope.
- Named business owners for those KPIs.
- A documented view of the source systems and relevant data flows.
- A working data model for the pilot use case.
- One or more production-quality dashboards or analytical outputs.
- Reconciliation evidence showing that important numbers match agreed source definitions.
- Appropriate access controls and refresh processes.
- A small group of real users actively using the solution.
- A prioritized backlog for the next phase.
- Baseline measures that allow leadership to judge whether the program is creating value.
The distinction matters. A dashboard that looks polished but cannot be reconciled is not a successful BI implementation. Neither is a technically elegant warehouse that nobody uses.
Days 1 to 15: Start With Decisions, Not Dashboards
The first two weeks should be mostly about understanding the business. This is where many BI projects either become focused or quietly become reporting wish lists.
1. Identify the decisions BI needs to improve
Do not begin with “What dashboards do you want?” Ask what recurring decisions are currently slow, disputed, manual, or poorly informed.

Examples include:
- Which sales opportunities require management intervention this week?
- Which customers or products are contributing most to margin?
- Where is marketing spend underperforming?
- Which operational exceptions require action today?
- Why did revenue, margin, conversion, or service performance move versus plan?
This changes the design conversation. A dashboard becomes an instrument for a decision rather than a collection of charts.
2. Select a narrow pilot
Choose a use case that matters enough to attract executive attention but is contained enough to deliver within the first 90 days.
A good pilot typically has a recognizable business owner, a manageable number of source systems, recurring demand for the analysis, and a result that users can independently validate.
Avoid choosing the hardest enterprise-wide problem merely because it is strategically important. Customer 360, global profitability, and enterprise-wide master data can be valuable, but they often involve identity resolution, governance, and organizational complexity that make them poor first pilots.
3. Define measurable outcomes
Before development starts, record the current state. How long does the report take to prepare? How many manual steps are involved? How frequently do teams dispute the number? How old is the data when the meeting starts? How many people rely on the output?
These baselines are more defensible than vague promises about becoming “data driven.”
4. Establish ownership
Every important KPI needs a business owner. The data team can implement a definition, but it should not unilaterally decide what “active customer,” “qualified pipeline,” “gross margin,” or “conversion” means.
A useful rule is simple: technology owns how the metric is produced; the business owns what the metric means.
Actiknow’s Business Intelligence services describe this same implementation sequence in practical terms: understanding requirements, creating solution architecture, integrating data, implementing BI tools, reviewing quality, and defining publishing and refresh mechanisms.
Days 16 to 30: Map the Data and Design the Minimum Architecture
Once the pilot is clear, move from business questions to data reality.
1. Inventory only the sources needed for the pilot
Document each relevant source, its owner, access method, refresh frequency, important entities, historical depth, and known quality issues.
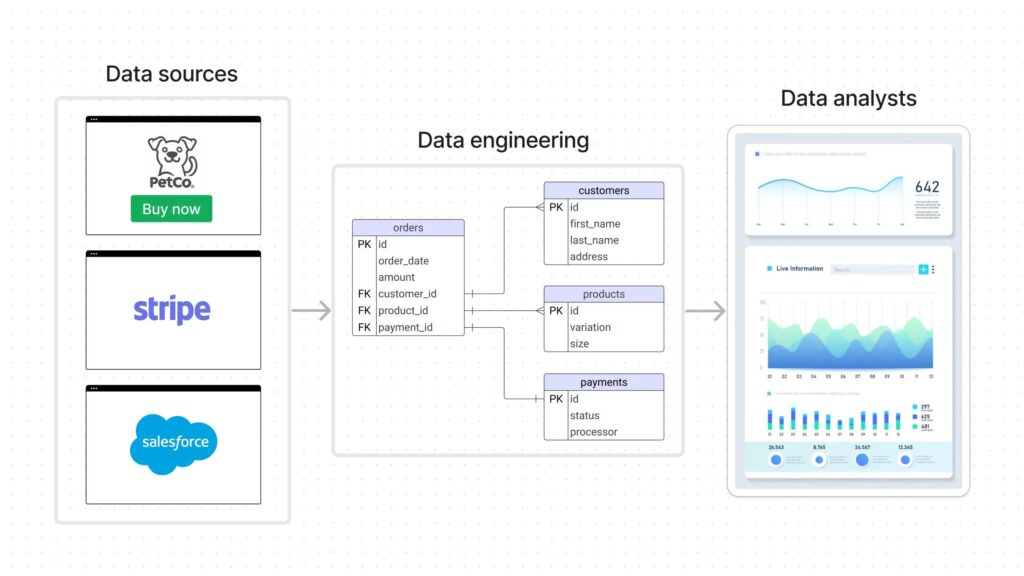
For a sales performance pilot, that might mean CRM opportunities, account data, targets from a planning system, and invoiced revenue from finance. You probably do not need HR, support, web analytics, and every historical spreadsheet in phase one.
2. Decide where transformation belongs
Some organizations can initially report directly from operational systems. Others need a warehouse or data lake because the analysis combines systems, requires history, or must support repeatable transformations.
The correct architecture depends on volume, complexity, latency, governance, skills, and expected growth. Do not add layers merely because they appear on a reference architecture.
Where custom integration or storage is required, Actiknow’s Custom Solutions offering includes API-based system integration plus database and data-lake setup. The relevant point for a 90-day BI program is not to maximize infrastructure. It is to create the smallest architecture that can reliably support the selected decisions.
3. Define grain before writing metrics
Many reporting errors are actually grain errors.
Is a row an order, order line, customer-day, opportunity, invoice, subscription, campaign, or website session? If teams aggregate measures without understanding this, duplicate counts and inflated totals are almost inevitable.
Document the grain of every important model and the cardinality of major joins.
4. Create the metric dictionary
For each KPI, record:
- Business definition.
- Formula.
- Source fields.
- Inclusion and exclusion rules.
- Date logic.
- Currency logic where relevant.
- Owner.
- Refresh expectation.
- Known limitations.
This document becomes one of the most valuable outputs of the first month because it converts informal assumptions into reviewable rules.
Days 31 to 45: Build the Data Foundation and Reconcile Early
This stage is where engineering begins in earnest, but reconciliation should happen alongside development rather than after the dashboard is finished.
1. Build ingestion for the pilot sources
Use the simplest reliable extraction mechanism appropriate to each source: database access, APIs, managed connectors, files, or controlled spreadsheet inputs.
Production pipelines should have clear failure behavior. A failed refresh should not silently present stale or partial information as current.
2. Separate raw data from business logic
Preserve source-level data where practical, then apply transformations in a controlled layer. This makes debugging easier because teams can distinguish “the source says this” from “our business rule transformed it into that.”
3. Build reusable business entities
Rather than placing all logic directly inside a dashboard, create reusable models for concepts such as customers, products, orders, opportunities, invoices, campaigns, or employees.
This reduces the risk that two dashboards independently implement the same metric differently.
4. Reconcile before visualization
Choose several important totals and compare them against trusted operational or financial sources for specific periods.
For example:
- Total invoiced revenue for last month.
- Number of closed-won opportunities for a fixed quarter.
- Active customer count on a known date.
- Orders by region for a selected week.
When differences appear, classify them. Is the problem caused by refresh timing, filters, joins, deleted records, time zones, currency conversion, source-system formulas, or genuinely different business definitions?
Document the answer. Reconciliation is not a nuisance before the “real” dashboard work. It is the work that creates trust.
Days 46 to 60: Build the Pilot Around Decisions
With reconciled data available, visualization can begin.
1. Design the executive layer first
Start with the questions a decision-maker needs answered. A useful executive page often needs fewer elements than teams expect:
- Current performance against target or prior period.
- Trend.
- Major drivers of change.
- Important exceptions.
- A route to investigate the cause.
Do not confuse information density with usefulness.
2. Create a diagnostic path
If a KPI is red, the user should know where to go next. A revenue variance might drill into region, customer, product, salesperson, or channel. An operations KPI might drill into location, process stage, or exception type.

The dashboard should support the management conversation, not merely display its starting number.
3. Design for the real audience
Executives, analysts, managers, and frontline users do not necessarily need the same experience. Decide who can see what, who needs detailed records, and who only needs aggregated views.
4. Test performance and refresh behavior
A dashboard that takes too long to load will be avoided regardless of how accurate it is. Test realistic filters, concurrency, dataset sizes, refresh windows, and failure scenarios before calling the pilot complete.
Days 61 to 75: Validate With Users and Run in Parallel
The next two weeks should expose the solution to reality.
1. Run old and new reporting together
For important reports, maintain a limited parallel period. Compare the BI output with the existing spreadsheet, CRM report, finance report, or manual process.

Do not assume the legacy number is automatically correct. The purpose is to explain differences, agree the correct definition, and make discrepancies visible before the new solution becomes authoritative.
2. Test edge cases
Normal records rarely reveal the hardest problems. Test refunds, cancellations, missing owners, reopened opportunities, late-arriving transactions, deleted records, zero-value transactions, duplicate customers, unusual currencies, and month-end boundaries where relevant.
3. Conduct user acceptance testing around decisions
Instead of asking users whether they “like the dashboard,” give them realistic tasks.
Can a sales leader identify the five opportunities most responsible for forecast risk? Can finance reproduce a monthly revenue total? Can an operations manager identify which locations created yesterday’s service exceptions?
Task-based testing produces much better feedback than aesthetic review.
4. Capture change requests without losing control
A successful pilot generates requests. That is healthy, but not every request belongs in the first release. Maintain a backlog and distinguish defects, definition corrections, usability improvements, and new scope.
Days 76 to 90: Productionize, Drive Adoption, and Decide What Comes Next
The final phase turns a working pilot into an operating capability.
1. Formalize production ownership
Document who owns pipeline failures, data-quality issues, dashboard changes, access requests, metric definitions, and source-system changes.

Without ownership, a BI product gradually degrades even when the initial implementation is excellent.
2. Put monitoring around refreshes
At minimum, monitor whether expected refreshes ran, whether row counts or data volumes changed unexpectedly, whether critical fields became null, and whether important reconciliation checks still pass.
Training should explain metric definitions, filters, refresh timing, known limitations, and the decisions the dashboard is intended to support. Teaching people where the export button sits is not adoption training.
4. Embed BI into an operating cadence
If the dashboard is meant to influence a weekly sales meeting, monthly business review, or daily operations huddle, make it the standard artifact for that process.
Adoption is strongest when BI replaces a recurring reporting behavior rather than becoming another optional destination.
5. Measure the pilot against the original baseline
Return to the measures recorded in the first two weeks.
Has preparation time fallen? Are fewer manual reconciliations required? Is information available earlier? Are recurring disputes about definitions declining? Are users actually accessing the solution? Can leaders identify and act on exceptions more quickly?
Not every benefit can be converted credibly into revenue. Operational measures are still valuable evidence.
6. Decide the next 90 days based on evidence
The next phase might expand the pilot to another business unit, add a new source, strengthen the warehouse, introduce governed self-service, improve data quality, or automate a downstream workflow.
Prioritize based on demonstrated usage and business value, not on which department asks for the largest dashboard.
The Governance You Need in the First 90 Days
“Governance” can sound like a program that requires committees, catalogs, and enterprise-wide policies before anyone can build anything. For an initial BI implementation, start smaller.
You need clear metric ownership, documented definitions, controlled access, a change process, source lineage sufficient to trace important numbers, and a way to identify whether data is current.
As usage expands, governance can become more sophisticated. The mistake is choosing between no governance and enterprise bureaucracy. There is a practical middle ground.
A Simple 90-Day Executive Scorecard
At the end of the pilot, leadership should review five dimensions.
Trust: Do critical metrics reconcile to agreed sources and definitions?
Use: Are the intended users actually using the solution in recurring business processes?
Speed: Has the time required to prepare or obtain decision-ready information improved?
Reliability: Are refreshes, permissions, and data-quality checks operating predictably?
Value: Has the pilot improved a measurable process, reduced manual effort, shortened a decision cycle, or enabled a useful action that was previously difficult?
A BI program that scores well on these dimensions has earned the right to expand.
Common Mistakes to Avoid
Trying to model the entire company first. Enterprise ambition is useful; enterprise scope in the first release often is not.
Choosing the BI tool before defining the problem. Tool selection matters, but it cannot fix unclear metrics or poor ownership.
Leaving reconciliation until the end. This creates a polished dashboard whose foundations may need to be rebuilt.
Treating every stakeholder request as a requirement. BI teams need a controlled backlog and an explicit pilot boundary.
Optimizing for launch rather than operation. Refresh monitoring, ownership, documentation, and support determine whether the solution still works six months later.
Measuring success by dashboard count. Ten dashboards that nobody trusts are less valuable than one embedded in an important management process.
Frequently Asked Questions
How long does a BI implementation take?
There is no universal duration. A contained pilot can often be structured within a 90-day program, while enterprise implementations can continue in phases for much longer. Complexity depends on source systems, data quality, security, metric definitions, integration requirements, and organizational readiness. The purpose of a 90-day roadmap is to prove a useful slice, not promise that all BI work will be finished in three months.
What should be delivered in the first 30 days?
The strongest early deliverables are usually a defined pilot, decision and KPI scope, business ownership, source inventory, initial architecture, metric dictionary, access plan, and measurable baseline. Starting dashboard development before these are clear often creates rework.
Do we need a data warehouse before implementing BI?
Not always. Reporting directly from operational systems can be reasonable for simple, contained use cases. A warehouse becomes more valuable when reporting combines multiple systems, needs historical snapshots, requires reusable transformation logic, or must scale across teams. Architecture should follow requirements.
Which BI tool should we choose first?
Choose based on your existing technology environment, security model, user needs, embedding requirements, skills, governance, scale, and total cost. Power BI, Tableau, Looker Studio, Excel, and other tools can all be appropriate in different contexts. Actiknow’s BI practice works across several of these platforms, which is one reason the architecture and business requirements should be settled before assuming a particular visualization tool.
How do we know whether users trust the dashboard?
Do not rely only on survey responses. Look for behavior. Are teams using the dashboard in recurring meetings? Have parallel spreadsheets declined? Are users still manually rebuilding the same metrics? Are reconciliation disputes decreasing? Trust is observable in how people work.
How many KPIs should the first dashboard contain?
There is no magic number. Include the smallest set that allows the target audience to understand performance, identify exceptions, and decide what to do next. If a metric does not support a decision or diagnostic path, question why it is there.
Should self-service analytics be part of the first 90 days?
Potentially, but governed self-service should usually follow trusted definitions and reusable datasets. Giving broad access to poorly defined data can scale inconsistency faster than it scales insight.
What happens after day 90?
Treat the pilot as evidence for the next investment decision. Expand what users trust and use, fix what remains fragile, and prioritize the next sources or use cases based on measurable value. The roadmap should become iterative rather than turning into an uncontrolled list of reports.
Final Takeaway
The first 90 days of BI are not about proving how much technology an organization can deploy. They are about proving that business questions can be translated into trusted data, useful analysis, and repeatable decisions.
Start with a narrow decision problem. Define the metrics. Build only the data foundation required. Reconcile early. Put the solution in front of real users. Run it alongside existing reporting long enough to establish trust. Then measure whether the new capability has changed the way the business operates.
That creates something more valuable than a dashboard launch: a repeatable method for expanding business intelligence without losing control of definitions, quality, or adoption.
If you are planning a BI implementation and want help turning requirements, data sources, architecture, dashboards, and refresh processes into a phased delivery plan, explore Actiknow’s Business Intelligence services or contact Actiknow to discuss the scope. A useful first conversation should establish the decisions you need to improve before it discusses the number of dashboards you need to build.