

A practical decision framework for CTOs, product owners and operations leaders
The launch question is not “Is the application fast?”
A new business application may look responsive during demonstrations and still struggle when a sales team imports thousands of records, a finance department runs month-end reports or hundreds of customers complete the same workflow. A quick demo proves that a feature can work. It does not establish that the application can support its intended operating conditions.
For a CTO, the useful question is more precise: Can the critical business journeys finish accurately, within an agreed time, at the expected workload and with enough headroom for predictable peaks? The answer requires a workload model, measurable acceptance criteria and evidence from repeatable tests. It does not require every screen to meet an arbitrary universal speed target.
This guide explains how to turn software performance testing into a business-led go-live decision, including what to measure, which scenarios to simulate, how to interpret bottlenecks and what to put in the release acceptance document.
1. Define performance in terms of business outcomes
Begin with the actions users depend on, not a list of API endpoints. An order-management platform may need a fast product lookup, a reliable order submission and a timely inventory update. A claims application may prioritize submission accuracy and document processing over the speed of a low-use settings page. An executive dashboard may need predictable morning refresh completion more than subsecond filter interactions.
Identify the five to ten journeys that would materially disrupt operations if slow or unavailable. For each, record the user, trigger, expected outcome, business deadline, dependencies and acceptable degraded behavior. This is the same requirements-first approach that should guide custom web application development: performance is part of the workflow specification, not a late infrastructure afterthought.

A sample performance acceptance matrix
Consider a hypothetical B2B ordering application. The following values are illustrative planning assumptions, not industry benchmarks or measured Actiknow results. They must be negotiated against actual user expectations, architecture and cost.
Product search: 95% of completed searches render usable results within 2 seconds at 120 active browsing users. Order confirmation: 95% of valid submissions receive a confirmed outcome within 3 seconds at 30 order submissions per minute. Bulk catalog import: 99% of accepted files up to the agreed size complete processing within 15 minutes. Management report: 95% of standard reports complete within 10 seconds at 15 concurrent report users. Across all journeys, business errors, duplicate orders and data loss are unacceptable even when latency targets are met.
Notice that the acceptance units differ. Search is an interactive experience; bulk import is asynchronous; a report is computationally intensive; an order submission changes authoritative data. Measuring all four by average HTTP response time would hide important failures.
2. Understand the five numbers that matter
Response time and end-to-end completion time
Measure from the user’s action to the moment a meaningful result is available. A backend endpoint returning in 200 milliseconds does not mean the user saw a usable screen in 200 milliseconds. Browser rendering, authentication, third-party calls, client-side processing and network conditions can add delay. For queued work, measure both acknowledgment time and final processing time.

Percentiles, not just averages
An average can look healthy while a minority of users experience severe delays. Report p50, p95 and, for high-impact workflows, p99. A p95 of 2 seconds means 95% of measured requests or journeys completed within 2 seconds under the specified test conditions. It does not mean every request completed in 2 seconds. Always state the population, measurement point and test window.
Throughput and arrival rate
Throughput describes work completed per unit of time: requests per second, orders per minute, records processed per hour or reports generated per minute. The arrival rate describes work entering the system. If arrivals exceed completions for long enough, queues and waiting times grow. A system can appear fast at 20 users yet fall behind when arrivals rise to 50 transactions per minute.
Concurrency
Concurrent users are not interchangeable with requests per second. One hundred logged-in users may generate very little traffic; twenty active users may run heavy queries simultaneously. Model think time, session behavior, workflow mix and background jobs. Define concurrency at the level relevant to the business, such as simultaneous checkouts, report executions or import workers.
Error rate and correctness
Count timeouts, rejected requests, exhausted retries and incorrect outcomes. Separate expected business validation failures from infrastructure or application faults. A fast response that silently loses a transaction is not a performance success. Correlate test transactions with database or system-of-record records, especially when queues, webhooks or payment services are involved.
3. Build a realistic workload model
Start with evidence: current system logs, historical peak hours, forecasted user volumes, seasonal campaigns, batch schedules and stakeholder interviews. If the product is new, make assumptions explicit and test more than one plausible scenario. Avoid claiming that a single number of virtual users represents production readiness.
For each workload, specify: active user population; arrival rate; journey mix; think time; test data volume; background processing; external service limits; and expected duration. Include authenticated and anonymous users where relevant. Make sure the test environment has realistic database sizes, indexes, caching behavior and integration paths. A staging system with a hundred test rows cannot establish the performance of a production database containing millions.

Use different test types for different questions
Smoke testing checks that the script and environment work with a very small workload. Baseline testing establishes current performance under ordinary conditions. Load testing measures behavior at expected traffic. Stress testing explores what happens beyond planned capacity and whether the system degrades safely. Spike testing probes abrupt demand changes. Soak testing checks sustained workloads for memory leaks, connection exhaustion, queue accumulation and other time-dependent issues.
These are complementary tests, not interchangeable labels. Grafana’s k6 guidance on automated performance testing describes these workload types and recommends using repeatable scenarios, meaningful thresholds and observability alongside test results.
Model peak traffic carefully
If a product expects 1,000 daily users, do not divide that number by 24 hours and call the result peak concurrency. Users cluster around office openings, announcements, payroll deadlines and campaign launches. Ask what happens during the busiest 15 minutes, and whether scheduled jobs or third-party integrations overlap that period. Model a credible peak and a separate contingency scenario, such as 1.5 times the expected arrival rate, as an explicit planning choice rather than a universal rule.
4. Set acceptance thresholds before the test
The most common governance failure is deciding whether results are acceptable only after seeing them. Document thresholds in advance, with the business owner and engineering lead approving them. Define the exact journey, load profile, duration, percentile, error allowance and data correctness check. Specify whether a breach blocks launch, triggers mitigation or requires documented risk acceptance.
A practical acceptance statement reads: “At 40 successful order submissions per minute for 30 minutes, p95 customer-visible confirmation time must be below 3 seconds, unexpected transaction failures below 0.5%, and no duplicate confirmed orders.” Those numbers are examples only. A healthcare, financial or safety-critical workflow may require substantially different criteria and additional assurance.
Tools can encode objective pass/fail checks. The official k6 thresholds documentation shows how to set percentile latency and error-rate criteria, while Microsoft Azure Load Testing supports failure criteria and automated runs for supported testing scripts. Tools enforce chosen conditions; they do not decide whether the business chose sensible ones.
Define the non-negotiables
Some failures should not be averaged away: lost payments, duplicated orders, exposure of another customer’s data, corrupted records, unbounded queue growth or a recovery process that never catches up. Record these as zero-tolerance correctness or security conditions where appropriate, and test them separately from aggregate latency.
5. Test the complete workflow, not just an endpoint
A simple HTTP load test is useful for isolating service capacity, but real users encounter login, permissions, data loading, validation, client rendering and downstream dependencies. Run at least one end-to-end scenario for every critical journey. Confirm both the response and the final business state. For example, an import endpoint returning HTTP 202 means the job was accepted, not that all records were imported successfully.
Use representative data distribution. Search for common and rare terms, submit small and large orders, test empty and high-cardinality filters, and include users with different permission scopes. Database plans, caching and serialization costs can vary substantially with the input. Parameterize test data so that repeatedly hitting one cached record does not create a misleadingly favorable result.
Include background jobs such as exports, scheduled reports, email delivery, reconciliation and ETL. If those processes share a database or compute pool with interactive users, they may be the real source of peak-hour contention.
6. Observe where time and capacity are consumed
A load test can tell you that a checkout took six seconds. It cannot, by itself, tell you whether the delay came from database locking, application CPU, a payment gateway, an undersized connection pool or an overloaded queue. Correlate test timestamps and trace identifiers with application metrics, distributed traces, database query plans, queue depth and infrastructure telemetry.
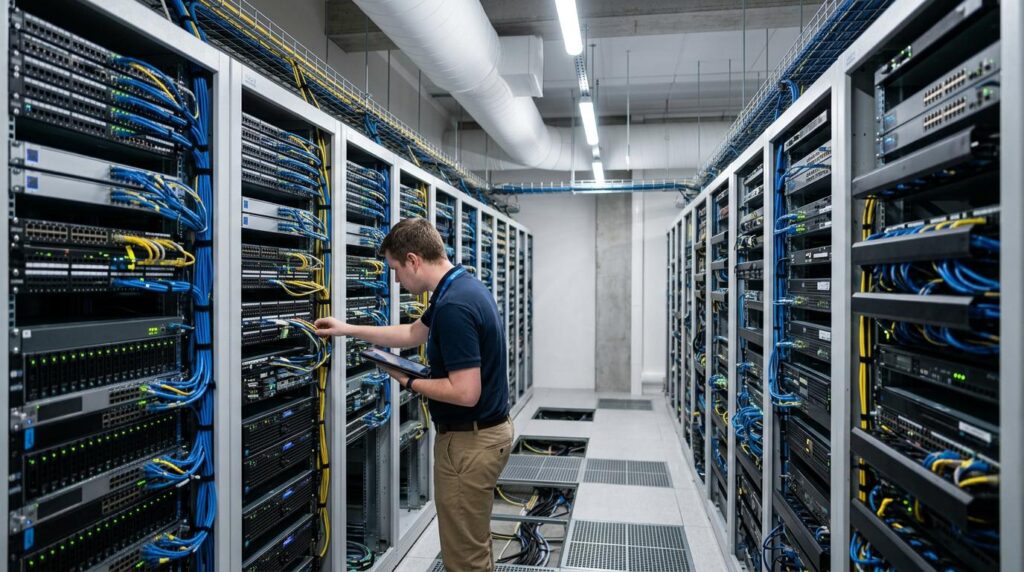
At minimum, capture service latency by endpoint and journey, error counts by cause, CPU and memory, database connections and slow queries, cache hit rates, external dependency latency, worker utilization and queue age. For autoscaled systems, record replica counts and scaling lag. Monitor the load generator too: a saturated generator can underproduce traffic and make the application appear stronger than it is.
Diagnose before scaling
More servers are not always the right answer. If a slow query scans a large table unnecessarily, indexing or query redesign may deliver a better result. If requests are serialized behind one global lock, adding web nodes may not help. If a vendor API imposes rate limits, more parallel workers may increase failures. Address the limiting component and rerun the same scenario to verify the change.
Performance optimization should continue after launch. Actiknow’s published application maintenance plans describe work such as server upgrades, slow-query analysis and data indexing; those are examples of operational improvement activities, not substitutes for pre-release evidence.
7. Design a credible test environment
An ideal pre-production environment resembles production in topology, configuration, data volume and integration behavior. Where exact parity is unaffordable, document every difference and its likely impact. A smaller database, disabled authentication, mocked payment service or different cache configuration changes what the test can prove.
Never send destructive or high-volume synthetic traffic to live customer systems without authorization and controls. Use synthetic accounts and non-sensitive datasets. Coordinate with payment processors, messaging vendors and other external providers; their sandboxes often have different limits and latency from production. For live canary testing, use tightly bounded traffic, monitoring and a rollback plan.
Run a baseline first, warm up where appropriate, and repeat important tests. Capture code version, infrastructure configuration, test scripts, datasets and results so a later run is comparable. Explain cold-cache versus warm-cache behavior rather than selectively reporting the faster run.
8. Distinguish load readiness from resilience
A system that performs well at steady load may still fail during a dependency outage or traffic spike. Test how it behaves when an upstream API slows, the database approaches its connection limit or a worker restarts. Verify timeouts, retry budgets, circuit breakers, backpressure and idempotency. In asynchronous systems, measure whether backlogs drain after the incident, not merely whether the API stayed available.
Set operational safeguards before launch: rate limits for expensive endpoints, capacity alerts, a way to disable nonessential background jobs, dashboards for critical journeys and named on-call ownership. A graceful response such as “Your report is queued” can be acceptable if the user understands what happens next and the system eventually delivers the result.
9. Turn results into a go-live decision
A performance report should not be a pile of charts. It should explain the tested build, environment, workload, thresholds, observed results, failures, unresolved risks and recommended decision. Separate confirmed evidence from assumptions and from issues that require further investigation.
A practical release evidence pack
Include an approved workload profile; a journey-by-journey acceptance matrix; test scripts and data assumptions; baseline, expected-load, peak and endurance results; error and correctness checks; traces of significant bottlenecks; remediation and retest records; infrastructure capacity notes; and a named owner for each residual risk.
Use three outcomes: Go when agreed criteria are met and monitoring is ready; Conditional go when explicitly bounded risks have documented mitigations and accountable approval; No-go when critical correctness, security, stability or business workflow criteria fail. Do not allow a high overall pass rate to obscure a failing payment or order-confirmation journey.

Example executive decision summary
“Release candidate 2.4 passed the agreed search and reporting targets under the expected-load profile. Order submission exceeded its p95 limit during the peak test, with database lock waits identified as the primary bottleneck. Engineering has a proposed fix but has not completed a repeat test. Recommendation: do not approve unrestricted launch; retest the peak order scenario and validate transaction integrity before sign-off.” This is a hypothetical illustration of reporting language, not a client case study.
10. A 30-day performance readiness plan
Days 1–5
Convene product, operations, engineering and QA. Rank critical journeys by business impact. Establish workload assumptions, target environments, acceptance criteria and the decision owner. Inventory external dependencies and identify any high-risk operations.
Days 6–10
Instrument the application and database, prepare representative test data and build smoke and baseline scripts. Validate that the generator can achieve intended traffic and that the business state is checked, not just HTTP response codes.
Days 11–18
Run expected-load and peak scenarios, plus spike and soak tests where justified. Compare p95/p99 latency, throughput, errors, queue behavior and infrastructure saturation. Reproduce and prioritize bottlenecks by business impact.
Days 19–25
Fix the highest-risk issues, repeat comparable tests and verify that optimization did not introduce correctness regressions. Confirm operational dashboards, alerts, runbooks and fallback procedures.
Days 26–30
Assemble the evidence pack, conduct business-owner sign-off and decide go, conditional go or no-go. Schedule a post-launch performance review using real traffic. The timeline is a planning example; complex systems or significant remediation may need longer.
11. Mistakes that create false confidence
Testing only the home page: It may be the least demanding part of the product. Test transactions, reporting and integrations that drive real value.
Using average latency as the headline: It can conceal poor tail performance. Include p95 and p99 where the workflow warrants them.
Equating virtual users with real concurrency: Traffic depends on actions, think time and arrival patterns. Specify a reproducible workload.
Ignoring data scale: Tiny test datasets conceal query and indexing problems. Use realistic sizes and distributions.
Testing with all integrations mocked: This is useful for component isolation but cannot validate end-to-end latency or vendor constraints. State what remains untested.
Declaring success from zero HTTP errors: A queued task may fail later or create a duplicate record. Reconcile final outcomes.
Buying more capacity without diagnosis: Scaling can be necessary, but first identify whether the bottleneck is CPU, database, locking, networking, third-party throttling or code.
Running one test once: Transient conditions can distort results. Repeat meaningful tests and preserve configurations for comparison.
Frequently asked questions
1. What is software performance testing?
It is the systematic evaluation of how an application behaves under defined workloads, including speed, throughput, stability, resource consumption and correctness. The result should inform engineering decisions and launch readiness.
2. How fast should a custom application be?
There is no universal answer. Set targets by user journey, business importance, expected workload and device or network conditions. A transaction confirmation, large export and background import should not share one generic threshold.
3. What is the difference between load and stress testing?
Load testing checks behavior at a defined expected workload. Stress testing explores behavior beyond expected limits, including how the system fails and recovers. Both matter, but they answer different questions.
4. Why measure p95 instead of average response time?
The p95 exposes slow experiences affecting the upper tail of the observed population. Averages can conceal these delays. Percentiles still need sample sizes, correct segmentation and a clearly specified measurement point.
5. How many concurrent users should we test?
Estimate from actual or forecast peak behavior, not registered accounts or daily active users alone. Include transaction arrival rates, workflow mix and background activity. Test a credible peak plus a documented contingency scenario.
6. Can we performance-test before production data exists?
Yes, with generated or de-identified representative data and clearly stated assumptions. The closer the volume and distribution resemble production, the more useful the findings. Retest when real usage becomes available.
7. Is API load testing enough?
No. It is useful for isolating backend capacity, but cannot fully establish browser experience, client rendering, authentication journeys or asynchronous completion. Add end-to-end tests for business-critical workflows.
8. What tools can teams use?
Common choices include k6, Apache JMeter, Locust and managed services such as Azure Load Testing. Choose based on protocols, scripting skills, scale, observability and CI/CD needs. The tool is less important than the quality of the workload and acceptance criteria.
9. Does passing a load test guarantee a successful launch?
No. It provides evidence for the conditions tested. Real production traffic, third-party failures, data distributions and configuration differences can expose new issues. Production monitoring, safe rollout and incident response remain essential.
10. Who should sign off performance readiness?
Engineering should attest to test quality and technical findings. Product or operations should approve business journey targets and residual impact. A named release owner should record the final decision, especially when exceptions are accepted.
The decision to launch should be evidence-led
Performance readiness is not a contest to achieve the lowest benchmark number. It is an agreement about what users need, how the system will behave under credible demand, and what the organization will do when limits are approached. A short, rigorous acceptance matrix backed by reproducible testing is more useful than a lengthy report without a decision.
For teams designing or modernizing a business application, Actiknow’s custom software services cover discovery, development, testing and deployment. If you need to translate business workflows into a practical pre-launch performance checklist, contact Actiknow to discuss the application, its expected workload and the evidence needed for a responsible release.
Selected technical references
Grafana k6: Thresholds and pass/fail criteria