

A business intelligence strategy should begin with a decision, not a dashboard.
Imagine a leadership meeting in which revenue is up, the sales pipeline looks healthy, and customer satisfaction appears stable. Finance nevertheless reports declining margins. The sales team attributes the difference to timing; operations points to rising delivery costs; marketing argues that its acquisition figures are being interpreted incorrectly. Each team has a report, but no one has a dependable way to connect the numbers.
The instinctive response is to buy a reporting platform or commission an executive dashboard. That may improve presentation without improving the decision. If customer, revenue, and cost definitions are inconsistent, a more attractive dashboard merely makes the disagreement easier to see.
A useful business intelligence strategy specifies which decisions must improve, what evidence those decisions require, who is accountable for the definitions, how information will be made trustworthy, and how the organization will know whether the investment worked. Technology follows those choices.
What is a business intelligence strategy?
A business intelligence (BI) strategy is an agreed plan for turning business data into reliable information that people use to make specific decisions. It connects business objectives to priority use cases, data sources, metric definitions, governance, technology, adoption, and measurable outcomes. A BI tool is one component of that plan, not the plan itself.
For a CEO, the strategy should explain what will change in management decisions. For a CFO, it should identify costs, benefits, and financial accountability. For a CIO or CTO, it should define a maintainable and secure way to deliver the information. For business leaders, it should clarify which metrics they own and how they will use them.
The difference between a reporting project and a BI strategy
A reporting project asks, “What should this dashboard show?” A strategy asks, “Which decision is currently constrained, and what would a better decision be worth?” Both questions matter, but the second must come first.
Consider customer profitability. A reporting request might ask for revenue by customer. A strategic use case asks which accounts should receive a pricing review, additional service capacity, or a different delivery model. Answering it may require CRM records, recognized revenue, project hours, support effort, and agreed cost-allocation rules. A revenue chart alone cannot answer it.
The strategy should also recognize where a dashboard is unnecessary. A recurring exception report, an alert, or a governed dataset used in an existing workflow may solve the problem more efficiently.
1. Start with five decisions, not fifty KPIs
Interview the people who make consequential decisions. Ask what they decide, how often they decide it, what information they use today, and what happens when that information arrives late or is wrong. Capture the decision in ordinary business language.
For example: “Every Monday, the sales director decides which opportunities need executive support.” The required evidence might include opportunity age, stage movement, recent customer activity, and historical conversion patterns. The desired action is an intervention on selected deals, not a prettier pipeline chart.
A useful decision brief records six things: decision owner; decision and cadence; current information gap; required evidence; action that the evidence could change; and a baseline against which improvement can be measured. Keep the first portfolio small enough that the business can validate it.
Prioritize use cases on business value, feasibility, and adoption. Value means the plausible consequence of improving the decision. Feasibility means that accessible data and workable definitions exist. Adoption means a named team will actually change its workflow. A high-value idea with no usable data may belong in a later phase; a technically easy dashboard with no decision owner should not lead the roadmap.
2. Define the metrics before connecting the systems
A single source of truth is not a single number for every question. Bookings, invoiced revenue, recognized revenue, and cash collected are different measures, and each can be correct in its own context. Trouble begins when a report labels all four “revenue.”
Create a concise metric dictionary for the initial use cases. For each KPI, record its business definition, formula, grain, inclusion and exclusion rules, date logic, currency treatment, authoritative source, owner, and expected refresh frequency. Document legitimate variants rather than hiding them.
Take “active customer.” Sales might mean a customer with an open opportunity, finance might mean one invoiced in the past year, and customer success might mean one with an active contract. Agree which definition applies to each decision. Where the organization needs several definitions, give them distinct names and make the differences visible.
The metric dictionary is a management agreement as much as a technical artifact. Finance, sales, and operations should approve the definitions they rely on. Engineers can implement the logic, but they should not be left to invent business policy from field names.
3. Audit data quality at the point of use
Before designing the architecture, inspect a representative sample of the records needed for the first decisions. Look for missing identifiers, duplicate customers, inconsistent statuses, changing source schemas, incomplete history, and fields that are entered differently across teams.
Pay particular attention to joins. A CRM account, an ERP customer, and a billing entity may not have a one-to-one relationship. A seemingly reasonable join can duplicate revenue or omit transactions. Historical changes in ownership, territory, and product classification can also alter the meaning of past performance.
Classify each issue by its consequence. A missing optional description may be harmless; an unreliable customer identifier may invalidate profitability reporting. Decide whether to correct the source process, add a controlled transformation, disclose a limitation, or defer the use case. Never treat a transformation rule as a substitute for fixing a broken operational process indefinitely.
Record reconciliation tests from the beginning. If a BI report shows monthly recognized revenue, specify the trusted financial report it must reconcile to and the expected differences due to timing, currency, exclusions, or adjustments. If totals differ, investigate before presenting the result as authoritative.
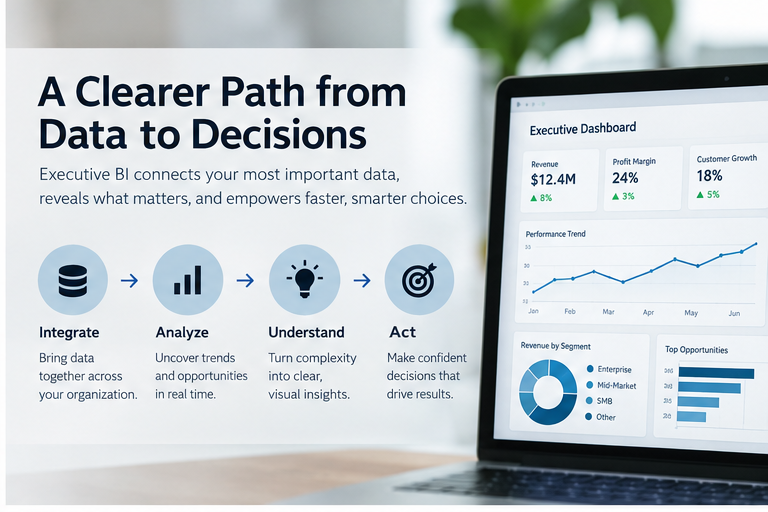
4. Choose the simplest architecture that meets the requirements
A business intelligence architecture may include source applications, ingestion, storage, transformations, a semantic or metric layer, reporting, and access controls. Not every company needs a separate product for each layer.
Direct reporting from an existing application may be sufficient when the questions stay within that application and its native reporting is reliable. A central analytical store becomes more useful when several sources must be joined, history must be retained, complex transformations must be reused, or reporting workloads should be separated from operational systems.
For example, an organization might integrate Salesforce, an accounting platform, and operational data into Snowflake or BigQuery; transform and test the data; and publish governed models to Power BI or Tableau. That is one possible architecture, not a universal prescription. Existing cloud contracts, security policies, internal skills, data volumes, latency requirements, and total cost should shape the choice.
Avoid building for an imagined future scale at the expense of today’s use cases. Equally, do not choose a shortcut that forces every report to recreate the same complex calculations. The goal is a maintainable foundation that can grow without making the first release unnecessarily expensive.
5. Make governance practical and explicit
Governance is often presented as a large enterprise program. For a first BI implementation, it can begin with clear ownership and a handful of enforceable rules.
Name an executive sponsor, a business owner for each KPI, a technical owner for each data pipeline, and an accountable owner for access approvals. Define who can view sensitive information, how changes to metric logic are approved, how failures are detected, and how users report suspected errors.
Apply least-privilege access. Customer names, personal information, compensation, and commercially sensitive figures may require different permissions. Row-level or object-level restrictions may be appropriate, but they must be tested against actual user roles. A report is not secure merely because its dashboard page is hidden if the underlying dataset remains accessible.
Maintain a short change log for important definitions and transformations. If the organization changes the meaning of “qualified lead,” it should know when the change occurred, which reports are affected, and whether historical comparisons remain valid.

6. Design reporting around the management rhythm
The best dashboard is the one that fits a real decision process. A weekly sales review needs different information from a monthly board meeting or a daily fulfillment stand-up.
For each report, define the audience, decision, cadence, action thresholds, and next step when a metric moves. An executive view should expose exceptions and drivers, with enough drill-down to investigate. It should not attempt to display every available field.
Refresh frequency should match the speed of the decision. A daily margin report may be sufficient when pricing changes happen weekly. A fulfillment exception may require more frequent updates. Real-time infrastructure is not valuable when nobody can act in real time.
Include context: targets, prior periods, relevant segments, and known data limitations. A conversion rate without the denominator, date range, and definition invites misinterpretation. Where a metric is estimated, label it as an estimate and explain the assumptions.
7. Treat adoption as part of implementation
A technically correct dashboard can fail because the organization continues to use old spreadsheets in meetings. Adoption requires more than a training session.
Bring business owners into prototype reviews. Test whether they can answer the intended question, understand the metric, and identify the action to take. Put the new report into the existing meeting agenda. Retire redundant reports only after the replacement has been reconciled and accepted.
Measure more than logins. Useful indicators include time to answer a recurring question, manual preparation hours, number of disputed metrics, report usage in decision meetings, and whether the intended action actually changed. A specialized report used by five accountable decision-makers may be more valuable than a widely viewed dashboard with no operational effect.

A 90-day BI strategy and implementation roadmap
Days 1–15: Identify decision owners, choose a small portfolio of use cases, document current reporting effort, and establish baseline outcomes. Inventory only the data needed for those use cases.
Days 16–30: Agree metric definitions, assess data access and quality, map joins, set access requirements, and select a proportionate architecture. Write acceptance tests before dashboard development.
Days 31–60: Build the first pipelines and governed models, reconcile outputs against source systems, and prototype the reports with business owners. Track unresolved data limitations openly.
Days 61–90: Put the first solution into management routines, train users, monitor pipeline health, measure early results, and decide whether the next use case is justified. A 90-day plan is an illustrative sequence, not a promise that every complex organization can finish in three months.
How to measure BI ROI without exaggerating it
Start with a baseline. Record the hours spent preparing recurring reports, the cost of correcting errors, the time required to answer important questions, and the financial outcomes that a decision might influence.
Separate three kinds of benefit. Cash savings occur when spending actually falls. Capacity released occurs when employees spend less time preparing data but payroll does not change. Decision benefits arise when better information leads to actions that improve margin, retention, inventory, or another outcome. Do not count the same benefit twice.
As an illustration, suppose four employees each spend six hours per week on recurring reporting. That is 24 hours weekly. At an assumed fully loaded cost of $35 per hour and 50 working weeks, the annual capacity involved is $42,000. If automation removes half the effort, it releases an estimated $21,000 of annual capacity. It is not automatically a $21,000 cash saving; management must identify what happens to the time.
Include implementation, licenses, infrastructure, maintenance, support, and training in the cost model. Then compare measured benefits against the baseline after launch. Where an improvement cannot reasonably be attributed to BI, describe it as a possible contribution rather than claiming the platform caused it.
Common BI strategy mistakes
Buying software before agreeing on decisions. A platform selection cannot resolve conflicting business definitions.
Trying to integrate every system in phase one. The resulting scope delays validation and obscures value.
Equating dashboard usage with business impact. Views do not prove better decisions.
Treating source-system numbers as automatically correct. Different systems may apply different timing, filters, and business rules.
Overengineering refresh frequency. More frequent updates can increase cost without improving actionability.
Leaving ownership with IT alone. Technology teams can build the system, but business leaders must own the meaning and use of its metrics.
What should a CEO, CIO, and CFO each approve?
The CEO should approve the decisions the initiative will improve, the accountable business owners, and the expected operational changes. The CIO or CTO should approve architecture, integration, security, maintainability, and the operating model. The CFO should challenge the baseline, benefit attribution, recurring costs, and the distinction between released capacity and realized savings. These approvals should converge on one phased plan rather than three independent projects.
Frequently asked questions
What are the key components of a business intelligence strategy?
A BI strategy should define business decisions and objectives, prioritized use cases, KPI definitions, data quality and integration requirements, governance, technology architecture, adoption plans, and success measures. The appropriate depth depends on the organization’s complexity.
How is a BI strategy different from a data strategy?
A data strategy covers the broader management and use of organizational data, including quality, governance, architecture, and operational needs. A BI strategy focuses on using data to support reporting, analysis, and business decisions. They should be aligned rather than developed in isolation.
Do small businesses need a BI strategy?
A small business may need only a short plan identifying the questions it needs answered, the sources of reliable information, and who owns the reports. It does not necessarily need a data warehouse or dedicated BI team. The strategy should be proportionate to the problem.
Should we choose Power BI or Tableau first?
Choose the reporting tool after identifying users, data sources, security requirements, existing technology, skills, and total cost. Both tools can support substantial BI programs; neither can compensate for unclear metrics or unreliable data.
Do we need a data warehouse for business intelligence?
Not always. Native application reporting or direct connections may meet simpler needs. A warehouse becomes more useful when data from several systems needs repeatable integration, historical preservation, consistent transformations, or independent analytical processing.
How long does a BI strategy take to develop?
A focused initial strategy can be developed over a short discovery phase if decision owners and data sources are accessible. Implementation may take weeks or months depending on source complexity, data quality, security, and organizational scope. Plan for incremental delivery and validation.
What is a single source of truth in BI?
It is an agreed, governed way to define and retrieve information for a given business question. It does not mean forcing distinct concepts such as bookings, recognized revenue, and cash collections into one metric. Trust comes from explicit definitions, lineage, and reconciliation.
Can AI create our BI strategy or replace dashboards?
AI can assist with exploration, summaries, documentation, and natural-language queries, but it cannot independently determine organizational priorities or make inconsistent source data trustworthy. Human owners must approve definitions, permissions, and consequential decisions.
How do we know if our BI strategy is working?
Compare post-launch results with the original baseline: reporting effort, reconciliation issues, decision turnaround time, adoption in management workflows, and attributable financial or operational outcomes. Reassess use cases that are not producing value.
Conclusion: Build a decision system, not a dashboard collection
A sound business intelligence strategy is a disciplined agreement about which decisions matter, what information they require, and how the organization will trust and use that information. Begin with a small set of consequential questions. Make definitions explicit. Validate the data. Choose an architecture that fits the workload. Put reporting into real management routines. Measure outcomes before expanding.
The result should not be a larger collection of charts. It should be a business that spends less time debating numbers and more time acting on them.
About Actiknow
Actiknow Consulting helps organizations connect fragmented systems, engineer reliable analytical data, and build business intelligence solutions using technologies such as Snowflake, BigQuery, Power BI, Tableau, and Looker Studio. If your organization is evaluating a BI strategy, start with a focused discovery of the decisions, data, and measurable outcomes that matter most. Learn more at actiknow.com.
Editorial note: The reporting-cost example is illustrative, not an industry benchmark. Add a verified Actiknow project example and an approved author biography before external website publication.