

Analytics ROI starts before the dashboard is built
A data analytics project does not create value because a warehouse is modern, a dashboard is attractive, or an AI interface can answer questions. It creates value when information changes a decision, reduces avoidable work, improves control, or enables an operating capability that matters financially.
That distinction is important because analytics business cases are unusually easy to overstate. Teams often count every hour theoretically saved as cash, attribute an entire revenue increase to a dashboard, or compare annual benefits with only the initial development cost. A credible ROI model does the opposite. It defines the decision being improved, establishes a baseline, measures only benefits that can reasonably be attributed to the project, and includes the ongoing cost of operating the solution.
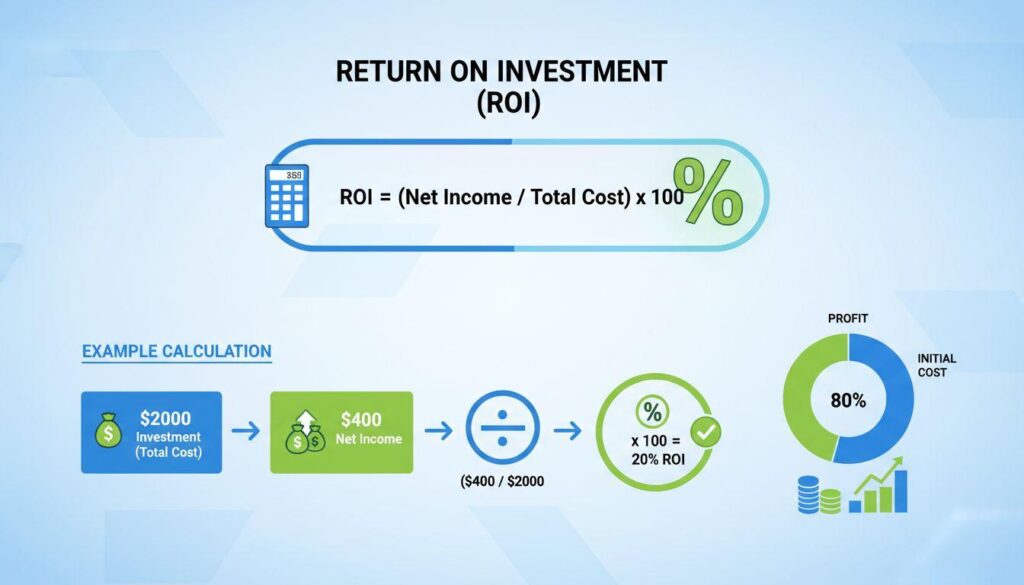
The basic ROI formula
A useful starting formula is:
ROI = (Risk-adjusted benefits – Total costs) / Total costs × 100
The arithmetic is simple. The hard work is deciding what belongs in benefits and costs. For executive approval, calculate both a cash view and an operational-value view. The cash view includes benefits that can realistically affect the P&L or cash flow. The operational view captures capacity released, faster decisions, better controls and reduced risk without pretending that every improvement becomes cash.
1. Define the business decision and baseline first
Before estimating benefits, state exactly what the project is intended to change. “Build a Power BI dashboard” is an output. “Reduce the time finance spends reconciling weekly revenue reporting and shorten the delay before management sees material variances” is a business objective.
Record the current baseline before implementation. Depending on the use case, that might include hours spent preparing reports, error and rework rates, time from data availability to decision, forecast variance, marketing spend that cannot be attributed, inventory exceptions, support backlog, or the number of manual data handoffs.
Actiknow’s business intelligence services cover dashboard implementation, BI consulting, data integration, analysis and automation. That scope illustrates an important ROI principle: visualization is usually only one component of an analytics solution. Data collection, modeling, reconciliation, security, publishing and maintenance also determine whether the business can use it.
2. Separate four types of benefit
Avoid putting every benefit into one optimistic savings number. Classify them.
Hard cost savings are expenses that can genuinely disappear or decline, such as retiring a reporting tool, avoiding outsourced reporting work, or eliminating infrastructure that is no longer required.
Capacity released is employee time that becomes available for other work. If five analysts each save four hours per week, that does not automatically equal five salaries saved. Value the capacity separately unless staffing, overtime or contractor spend will actually change.
Revenue and margin benefits require the strongest attribution discipline. Better segmentation may help a commercial team allocate spend more effectively, but a revenue increase can also be influenced by pricing, seasonality, product changes and market conditions. Use controlled tests, matched periods, cohort analysis or another defensible method where possible. When attribution is weak, present a range rather than a single claim.
Risk and control benefits include fewer reporting errors, earlier detection of anomalies, improved access control or more reliable regulatory reporting. Some can be valued using expected loss: probability of an event multiplied by its estimated impact. Others should remain non-financial benefits if the evidence is too uncertain.
3. Calculate the full lifecycle cost
The denominator should not stop at implementation fees. Include discovery and architecture, engineering, data migration, BI development, testing, project management, cloud and software licenses, connector costs, training, security work, internal stakeholder time, and ongoing support.
Also include change. APIs evolve, source schemas change, business definitions are revised, users request new dimensions and platform pricing changes. Actiknow’s maintenance plans, for example, explicitly cover areas such as patches, library updates, performance optimization and developer support. Whether maintenance is internal or outsourced, it belongs in the economics of the solution.
For multi-year decisions, model costs and benefits over the same horizon. A project with a large first-year build cost and relatively stable operating cost can look very different over three years than it does over twelve months.
4. Risk-adjust the benefits instead of hiding uncertainty
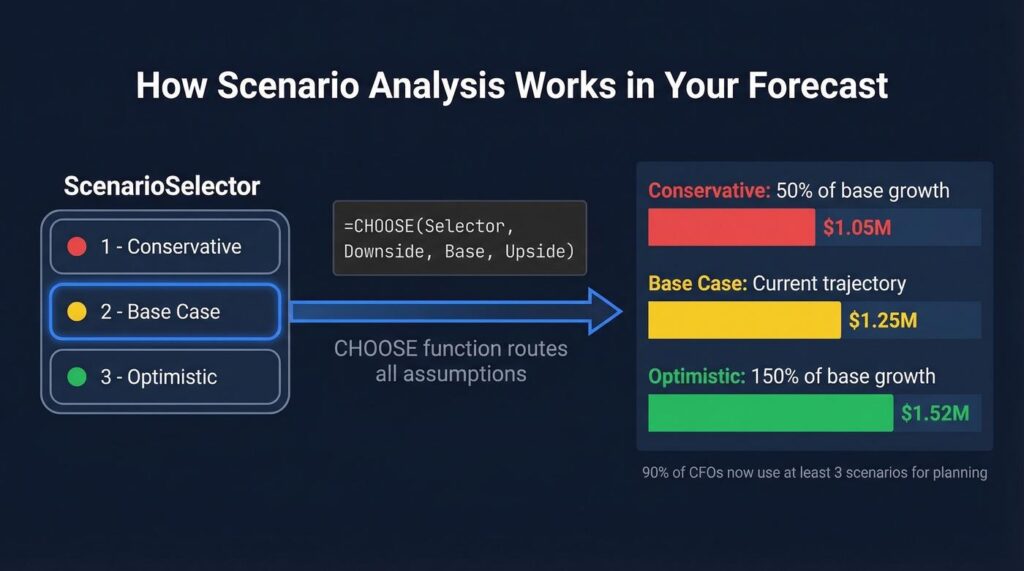
Executives should not have to choose between an inflated business case and no business case. Use scenarios.
Suppose a hypothetical analytics automation is expected to release 3,000 staff hours annually. If the fully loaded labor rate used for planning is $50 per hour, the theoretical capacity value is $150,000. But if only 60% of that capacity is expected to be redeployed productively, the risk-adjusted operational value is $90,000. It is still not a $90,000 cash saving unless payroll or external spend changes. These figures are illustrative only.
Build conservative, expected and upside cases. Make the assumptions visible. Decision-makers can then challenge the utilization rate, adoption rate, expected error reduction or attribution factor instead of debating a mysterious final ROI percentage.
5. Include adoption in the model
A technically successful analytics project can have poor economics if users do not change their behavior. If the business case assumes that 100 managers will use a new view but only 30 incorporate it into their operating reviews, the realized benefit should reflect that.
Track adoption at the workflow level, not merely logins. Did the dashboard replace a manual report? Are meetings using the governed metric? Are identified exceptions assigned and resolved? Did analysts stop maintaining the old spreadsheet? Adoption is strongest when an old process is deliberately retired rather than left running in parallel forever.
6. Measure value after go-live
The ROI calculation used for approval is a hypothesis. Recalculate it after implementation using observed data.
At 30, 90 and 180 days, compare the agreed baseline with actual performance. Recheck preparation time, error rates, decision latency, system costs, adoption and any business outcome the project was intended to influence. Record which assumptions were wrong. This turns ROI from sales arithmetic into a governance mechanism for the analytics portfolio.
If the project includes several data sources, measurement should also account for the engineering required to keep them reliable. Actiknow’s solution accelerators include data connectors designed around integration across sources and destinations. The broader lesson is that recurring integration effort, monitoring and exception handling should be visible in both the operating model and the ROI calculation.
A practical analytics ROI scorecard
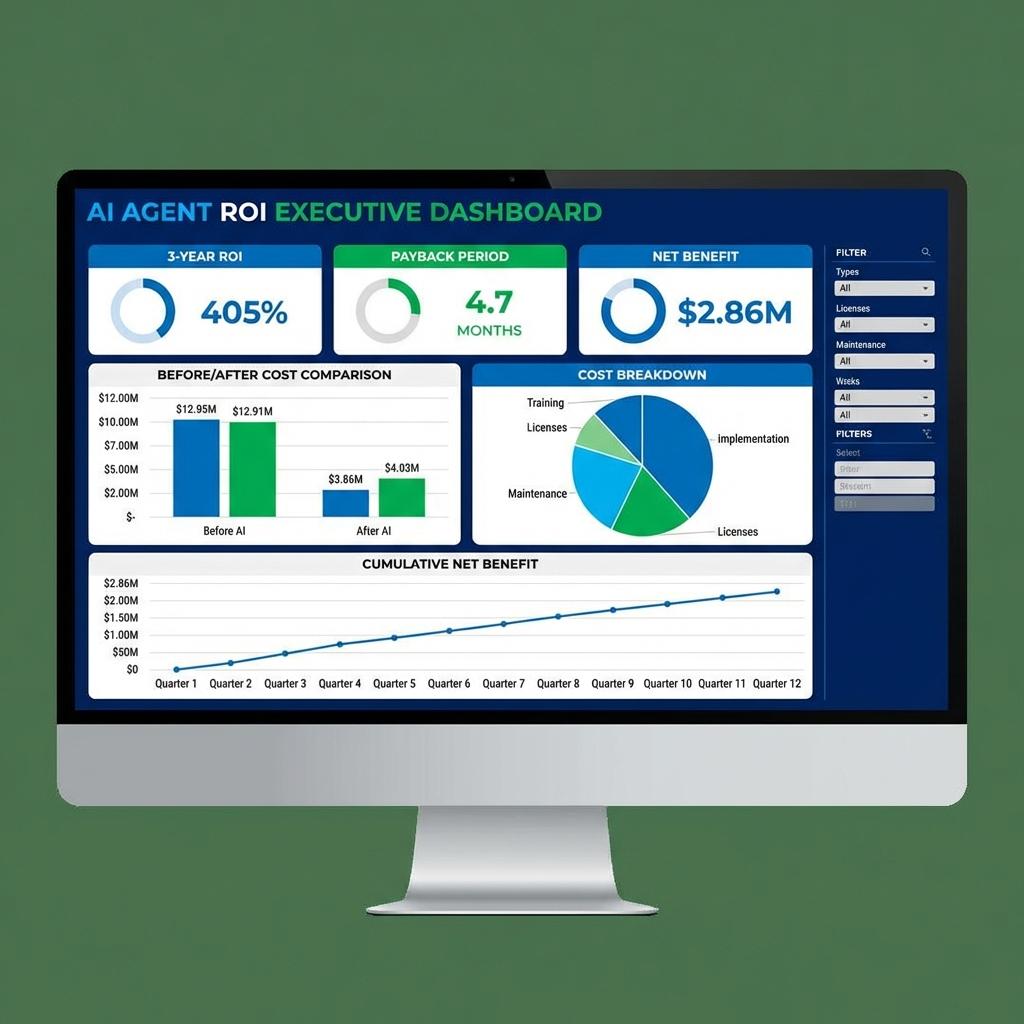
For each initiative, executives should be able to see the baseline metric, target outcome, benefit category, benefit owner, measurement method, attribution confidence, one-time cost, recurring cost, adoption measure, review date and actual realized benefit.
The benefit owner matters. IT or the data team may deliver the platform, but Sales owns sales outcomes, Finance owns reporting efficiency, and Operations owns process performance. Requiring a business owner for each benefit prevents the analytics team from being held accountable for outcomes it cannot control.
When ROI should not be the only decision criterion
Some analytics investments are foundational. A regulatory reporting requirement, security control, data-retention obligation or replacement of an unsupported platform may be necessary even when a conventional ROI percentage is unimpressive. In these cases, present the cost of compliance or risk reduction transparently rather than forcing the project into an artificial revenue story.
Similarly, an initial data platform may enable several later use cases. Do not allocate all foundational cost to the first dashboard, but do not pretend the foundation is free either. Maintain a portfolio view showing shared platform costs and the incremental economics of each use case.
Frequently asked questions
What is a good ROI for a data analytics project?
There is no universal threshold. Required returns depend on the organization’s cost of capital, risk, strategic importance and alternative investments. Compare projects using consistent assumptions rather than a generic benchmark.
How do you calculate time savings from analytics?
Measure the current process, estimate or observe the new process, multiply the difference by frequency and affected users, then distinguish capacity released from actual cash savings. Adjust for adoption and time spent maintaining the new process.
Should software licenses be included in analytics ROI?
Yes. Include recurring BI, cloud, data integration and other platform costs attributable to the solution, together with implementation and maintenance costs.
How do you measure revenue generated by analytics?
Use the strongest feasible attribution method, such as controlled experiments, cohorts, matched comparisons or documented decision-level attribution. Where causality cannot be established, report the benefit as directional or use a probability-adjusted range.
How long should an analytics ROI model run?
Use a horizon appropriate to the investment and compare benefits and costs over the same period. For longer horizons, consider discounted cash flow rather than simply adding future dollars together.
Can a project be worthwhile with negative short-term ROI? Yes. Foundational data work, compliance, security and platform migrations can be justified by risk, strategic capability or future use cases. State that rationale explicitly instead of manufacturing short-term savings.
Build a business case you can measure later
The strongest analytics business case is one the organization is willing to revisit after launch. Define the decision, baseline and benefit owner before development; include full lifecycle costs; separate cash from capacity; risk-adjust uncertain benefits; and measure actual outcomes after adoption.
If you are evaluating a BI or analytics initiative and want to scope the data, integration and reporting work behind the business case, review Actiknow’s business intelligence capabilities and contact the team to discuss a focused discovery and implementation plan.