
Power BI Embedded Pricing Is More Than a License Cost
Embedding analytics into a SaaS product can be a strong product decision. Customers get reporting inside the application they already use, product teams avoid building every charting and analytical capability from scratch, and the analytics experience can become part of the product rather than a separate destination.
The budgeting mistake is to treat Power BI Embedded as a simple per-user software subscription.
For a SaaS company, the real cost has several layers: Microsoft capacity, creator licenses, application development, authentication, tenant isolation, data architecture, refresh workloads, performance engineering, monitoring, support, and future scaling. The cheapest capacity that technically runs a report is not necessarily the lowest-cost production architecture.
That distinction matters because Power BI Embedded is infrastructure inside your product experience. If reports are slow, unavailable, insecure, or expensive to operate, customers experience that as a problem with your SaaS product.
Actiknow’s Business Intelligence services include Power BI implementation, data-source integration, modeling, publishing, embedding, and refresh mechanisms. For founders evaluating embedded analytics, the useful starting point is therefore not “Which SKU should I buy?” but “What workload and customer experience am I actually trying to support?”
1. Start With the Embedding Model
Microsoft supports different embedding scenarios, and the economics differ.
For customer-facing SaaS products, the common model is “embed for your customers,” also called app-owns-data. Your application authenticates to Power BI and presents content to customers inside your product. Microsoft’s current guidance states that end users in this scenario do not need individual Power BI licenses, but production requires appropriate capacity.
For internal organizational embedding, the licensing model can be different because users may authenticate with their own Power BI identities and licenses.
A SaaS founder should settle this architectural decision before estimating cost. Otherwise, licensing assumptions can be wrong before development begins.
Questions to answer:
- Who will consume the reports: your employees, your customers, or both?
- Will customers authenticate only to your SaaS application?
- Will every tenant see the same analytical model with filtered data, or will tenants have different models?
- Do customers need only viewing, or also exports, drill-through, self-service analysis, or report authoring?
- How many simultaneous viewers do you expect at peak, not merely how many registered users exist?
These questions determine much more than the license.
2. Capacity Is the Visible Cost, Not the Whole Cost
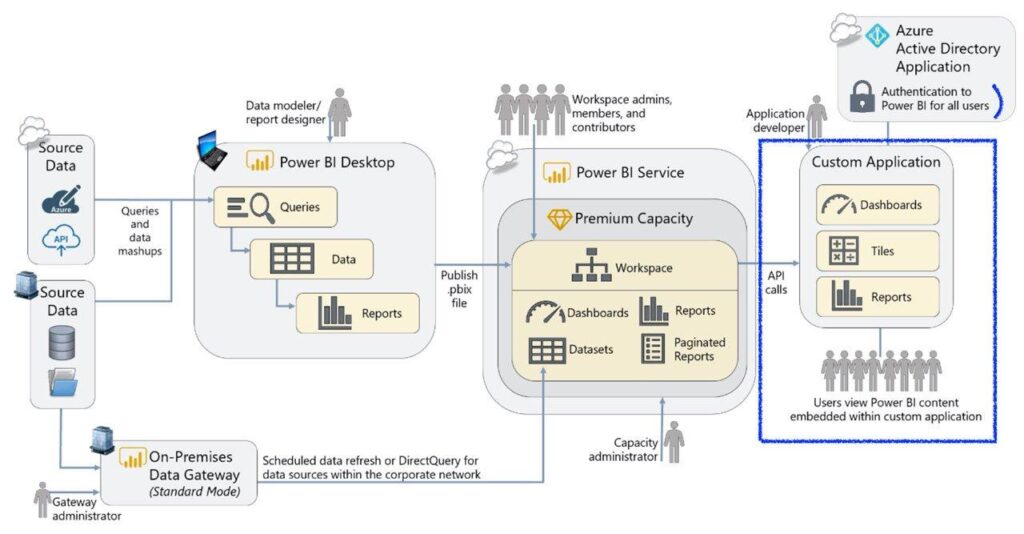
Power BI Embedded production workloads require capacity. Microsoft currently supports multiple capacity families and is moving customers toward Fabric capacity options in several scenarios. Capacity provides the compute used for workloads such as report rendering and semantic-model refresh.
For budgeting, avoid hard-coding today’s Microsoft list price into a three-year SaaS model. Pricing, SKU availability, purchasing models, and product packaging can change.
Instead, model capacity as a variable with three inputs:
Baseline capacity: the compute required during normal usage.
Peak capacity: the compute required when customer concurrency, report complexity, or refresh activity spikes.
Operating schedule: whether the chosen capacity model can be scaled, paused, resumed, or otherwise optimized around usage.
The financial question is not “What does Power BI Embedded cost per month?” It is “What capacity profile does our workload require, and how will that profile change as customers and usage grow?”
3. Model Cost Against Concurrency, Not Customer Count Alone
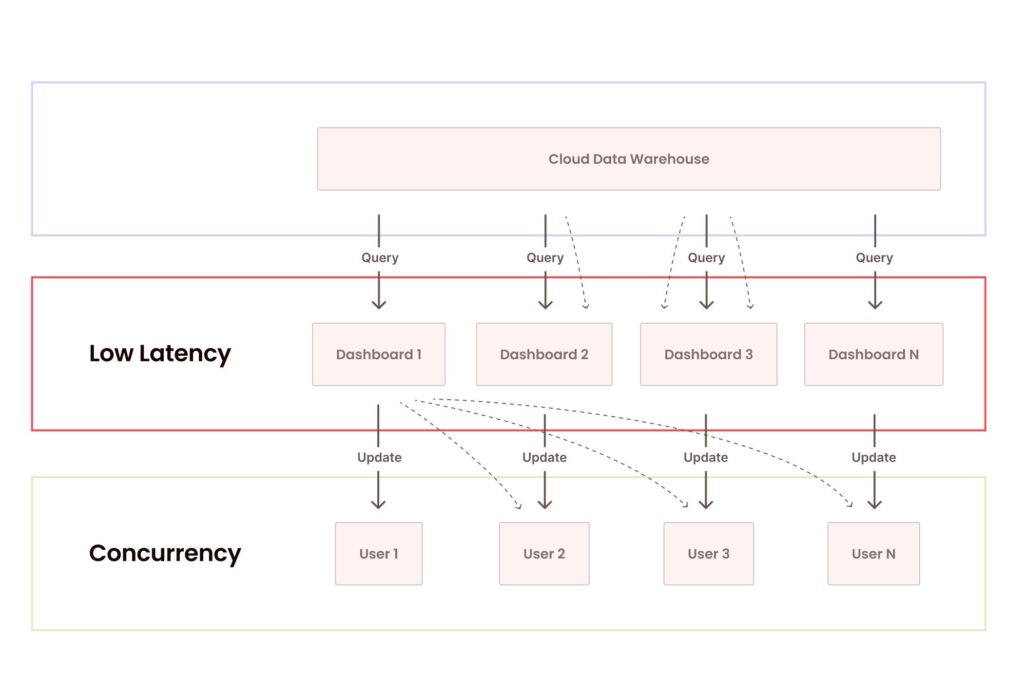
A SaaS company with 20,000 registered users does not necessarily need dramatically more analytics capacity than one with 2,000 users. What matters is how many users are active simultaneously, what they are doing, and how expensive each interaction is.
Consider two products.
Product A has thousands of users, but customers open a simple dashboard once a week.
Product B has fewer customers, but operational teams keep complex reports open throughout the day, repeatedly filter large datasets, export data, and trigger expensive queries.
Product B can create the larger capacity requirement.
Your budget model should therefore estimate:
- monthly active analytics users;
- peak concurrent viewers;
- report opens per active user;
- average interaction intensity;
- semantic-model size;
- refresh frequency;
- DirectQuery or live-query demand where applicable;
- export activity;
- peak-hour concentration.
This is why a load test is financially useful. It converts a vague licensing estimate into an evidence-based capacity decision.
4. Budget for the Data Layer Behind the Dashboard
Power BI may be the visible analytics layer, but embedded reporting still depends on a reliable data architecture.
If every report interaction causes inefficient queries against an operational database, you may save on one part of the stack and create performance or infrastructure costs elsewhere.
Typical underlying costs can include:
- a cloud database or warehouse;
- ETL or ELT pipelines;
- API ingestion;
- data transformation;
- storage;
- orchestration;
- data-quality checks;
- monitoring;
- development and test environments.
Actiknow’s Custom Solutions practice includes system integrations, databases and data lakes, and client-facing applications. That combination matters in embedded analytics because the reporting layer and application architecture should be designed together rather than treated as unrelated projects.
For many SaaS products, the best optimization is not a cheaper BI SKU. It is a better semantic model, a better aggregation strategy, or fewer unnecessary queries.
5. Tenant Isolation Has a Cost
Multi-tenant SaaS analytics introduces a requirement that an internal company dashboard often does not have: one customer must never see another customer’s data.
That requirement affects design.
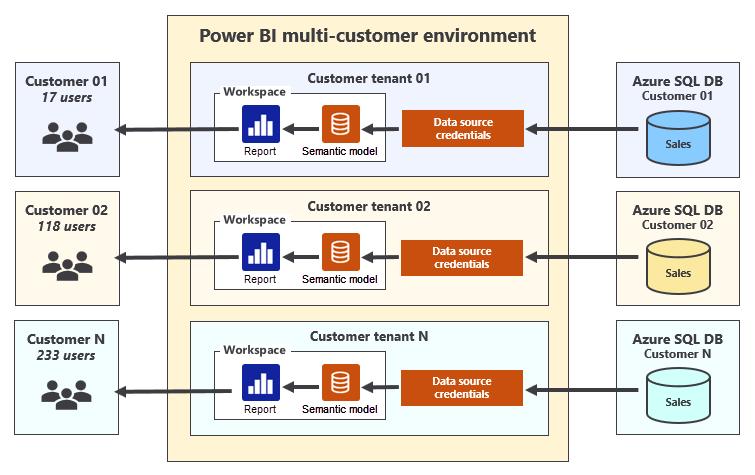
Common patterns can include shared semantic models with tenant-aware filtering, separate workspaces or models for groups of customers, and more isolated deployments for customers with exceptional security or scale requirements.
There is no universally correct pattern. Greater isolation can simplify some security boundaries but increase deployment, refresh, monitoring, and operational overhead. Shared models can be efficient but demand disciplined identity, filtering, testing, and governance.
Budget for the engineering needed to prove isolation, not merely configure it.
Your release process should test:
- tenant identity propagation;
- row-level filtering;
- export behavior;
- drill-through;
- cached states;
- API access;
- administrative roles;
- new-tenant provisioning;
- offboarding.
A data leak between SaaS tenants is not a dashboard defect. It is a product security incident.
6. Do Not Forget Creator and Administrative Licensing
Even when customers do not require individual Power BI licenses in an app-owns-data scenario, the people building and managing the analytical content may require appropriate Power BI licenses.
Your budget should account for the internal team that develops, publishes, tests, and administers reports.
Depending on your operating model, that may include BI developers, data engineers, QA staff, product managers, support personnel, and administrators.
The number may be small relative to your customer base, but it should not disappear from the financial model.
7. Development Cost Is Usually Front-Loaded
Embedding a report is not the same as shipping a production analytics feature.
A production implementation can require:
- Microsoft Entra application registration;
- service-principal or identity configuration;
- server-side token generation;
- Power BI REST API integration;
- embedding configuration;
- application-side authorization;
- tenant mapping;
- error handling;
- loading and empty states;
- responsive behavior;
- navigation and filters;
- telemetry;
- deployment automation.
There is also product work. What happens when a user has no data? Can the user export? Should filters persist? Does the report inherit the product’s navigation? What happens on mobile? What support message appears when capacity or an upstream data source is unavailable?
If analytics is part of your paid SaaS experience, these are product requirements, not implementation details.
8. Report Design Directly Affects Infrastructure Cost
Poorly designed reports can consume more resources than necessary.
Cost optimization therefore belongs partly in BI engineering.
Review:
- the number of visuals on a page;
- high-cardinality fields;
- expensive DAX;
- unnecessary interactions;
- semantic-model design;
- data granularity;
- aggregation opportunities;
- refresh patterns;
- DirectQuery usage;
- large exports.
A report that performs well with one developer is not automatically ready for hundreds of concurrent customer sessions.
Performance testing should happen before choosing the final production capacity, not after the annual budget is approved.
9. Include Refresh and Background Workloads
Customer interaction is only one consumer of capacity.
Semantic-model refreshes and other background workloads can overlap with interactive usage. A large refresh at the same time customers are opening dashboards can change the experience.
For SaaS budgeting, map a 24-hour workload profile.
- When do data pipelines finish?
- When do semantic models refresh?
- When do US, UK, and Australian customers create usage peaks?
- Do customer time zones create a nearly continuous demand window?
- Can refreshes be staggered?
- Which datasets genuinely need frequent refreshes?
“Real time” is often an expensive requirement that has never been translated into a business decision. If customers make decisions daily, a well-controlled hourly or scheduled refresh may be more valuable than a technically impressive architecture with unnecessary cost.

10. Add Monitoring and Support to the TCO
Once analytics is embedded, customers will contact your support team when something looks wrong.
The issue might be:
- a Power BI capacity constraint;
- a failed data pipeline;
- an expired credential;
- a source-system API problem;
- a refresh failure;
- a semantic-model change;
- an application authorization defect;
- a customer misunderstanding of a metric.
Without observability, these incidents become slow investigations across multiple systems.
Budget for monitoring that helps answer:
- Is the embedded service healthy?
- Are refreshes succeeding?
- Are reports loading within an acceptable time?
- Which tenants are generating unusual load?
- Are errors caused by the application, Power BI, or an upstream source?
- Did a deployment change performance?
Supportability is part of the architecture.
11. Build a Three-Scenario Budget
A practical founder-level model should contain at least three scenarios.
Base case: expected customers, normal concurrency, expected refresh frequency, and the capacity supported by testing.
Growth case: customer adoption exceeds plan, analytics usage increases, datasets grow, and more customers use reports simultaneously.
Stress case: a major tenant or product launch creates a concentrated usage spike.
For each scenario, estimate:
- Microsoft capacity;
- internal Power BI licenses;
- data-platform infrastructure;
- integration and pipeline costs;
- development and QA;
- monitoring;
- support and maintenance;
- security and compliance effort.
Then calculate cost per active analytics customer or cost per analytics-enabled account. This gives product leadership a metric that can be compared with the commercial value of the feature.
12. Decide How Analytics Fits Your SaaS Packaging
Embedded analytics should have a commercial model, even when you do not separately charge for it.
Possible approaches include:
- include a standard dashboard in every plan;
- reserve advanced analytics for higher tiers;
- sell analytics as an add-on;
- provide standard reporting but charge for custom reports;
- apply limits to expensive exports or highly frequent refresh;
- create enterprise packages for greater isolation or dedicated analytical environments.
The objective is not to recover every infrastructure dollar directly. It is to ensure the analytics feature has an intentional relationship with pricing, retention, differentiation, or expansion revenue.
If analytics materially increases your cloud and support costs while remaining invisible in packaging decisions, margin can deteriorate as adoption improves.
A Simple Power BI Embedded Budgeting Framework
Before approving the implementation, put the following on one page:
Audience: internal users, external customers, or both.
Embedding model: app-owns-data or user-owns-data.
Expected scale: active users and peak concurrency.
Workload: model sizes, interactions, refreshes, exports, and query patterns.
Isolation: shared or separated tenant architecture.
Capacity: baseline, peak, and scaling assumptions.
Data platform: warehouse, pipelines, transformations, storage, and monitoring.
Build cost: application integration, BI development, QA, and DevOps.
Run cost: capacity, licenses, infrastructure, monitoring, support, and maintenance.
Commercial model: included feature, tier differentiator, add-on, or enterprise option.
If one of these lines is missing, the budget is probably incomplete.
What Should a SaaS Founder Optimize First?
Do not begin by minimizing capacity.
Begin by minimizing uncertainty.
Prototype the customer experience. Build a representative semantic model. Use realistic data volumes. Simulate concurrency. Measure refresh and interaction behavior. Validate tenant isolation. Then choose capacity based on evidence.
That sequence may reveal that a smaller capacity is sufficient. It may also show that the original architecture was unrealistic.
Both outcomes are valuable before launch.
Frequently Asked Questions
Does every SaaS customer need a Power BI license?
Not necessarily. In Microsoft’s embed-for-your-customers, or app-owns-data, model, application users do not need individual Power BI licenses. Production still requires an appropriate capacity, and internal content creators or administrators may have separate licensing requirements.
Can we use Power BI Embedded without buying capacity?
Microsoft provides development and trial paths, but its current guidance requires capacity for production embedded-for-customers deployments. Treat trial mechanisms as development tools, not a production cost strategy.
Should we choose the smallest capacity and upgrade later?
You can begin conservatively, but capacity should be selected using representative workload and concurrency testing. Starting too small can create poor customer experience, while buying too much capacity can waste margin. The correct starting point is evidence, not guesswork.
Is Power BI Embedded cheaper than building analytics ourselves?
There is no universal answer. Power BI can avoid substantial work involved in building reporting, visualization, filtering, exports, semantic modeling, and administration from scratch. But you still need application integration, data engineering, security, testing, and operations. Compare total cost of ownership and time to market rather than license cost alone.
How should we budget for a multi-tenant SaaS product?
Model capacity, peak concurrency, tenant-isolation architecture, data infrastructure, creator licenses, engineering, QA, monitoring, and support. Also model how those costs change as customer adoption and dataset sizes grow.
Do we need a separate Power BI environment for every customer?
Not automatically. Multi-tenant designs can use shared resources with tenant-aware security, more isolated models, or combinations of both. The right choice depends on security, customization, performance, operational complexity, and customer requirements.
How often should embedded dashboards refresh?
Refresh frequency should follow the business decision the dashboard supports. Higher frequency can increase pipeline, source-system, and analytical workload. Define the maximum acceptable data age first, then engineer to that requirement.
Call to Action
If you are deciding whether Power BI Embedded fits your SaaS product, the most useful exercise is a workload and architecture review before committing to a production capacity. Actiknow can help evaluate the application integration, data model, embedding architecture, tenant isolation, performance assumptions, and ongoing operating model. Talk to Actiknow about your embedded analytics requirements.