

A slow Power BI report is usually a systems problem, not a visual-design problem
When a Power BI report takes eight or ten seconds to respond, the obvious reaction is to blame the dashboard. Reduce the number of charts. Remove animations. Change the theme. Upgrade capacity.
Sometimes that helps. Often it does not.
Power BI performance is the result of several layers working together: the source system, data preparation, semantic model, storage mode, DAX, report visuals, security rules, refresh design, network path, and the capacity serving the workload. A delay visible on a report page can originate much earlier in that chain.
The practical question is therefore not “How do we make Power BI faster?” It is “Which layer is consuming the time, and what is the lowest-risk fix?”
That diagnostic mindset matters because performance work can otherwise become expensive trial and error. Actiknow’s business intelligence services cover BI architecture, data-source integration, Power BI implementation, publishing, and refresh mechanisms. Those layers are connected, so performance should be investigated across the complete reporting path rather than only inside the report canvas.
Start by defining what “slow” actually means
Before optimizing anything, reproduce the problem.
A useful performance investigation records:
- which report and page is affected;
- which user or role experiences the delay;
- whether the issue occurs on initial load, filtering, drill-through, navigation, or refresh;
- whether it affects every page or only particular visuals;
- whether it happens consistently or only at busy times;
- whether the report uses Import, DirectQuery, Direct Lake, or a composite model;
- whether row-level security is involved;
- what changed before the slowdown appeared.
This separates three very different complaints.
A slow report interaction means the user is waiting for a visual or page to respond.
A slow semantic-model refresh means the data takes too long to ingest and process.
A stale report means refresh frequency or refresh reliability is inadequate.
They may share root causes, but they are not the same performance problem.
1. Diagnose before you redesign
The first goal is to identify where the elapsed time is being spent.
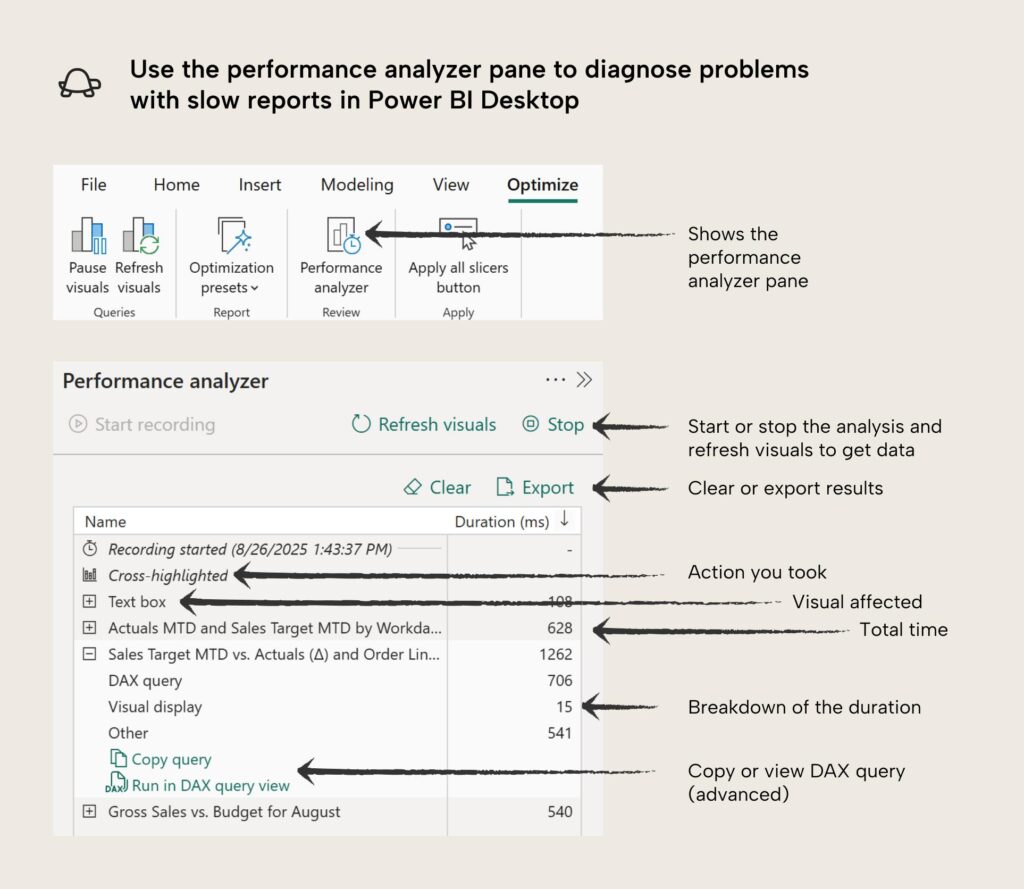
For report interactions, Power BI Performance Analyzer is a useful starting point because it can show the duration associated with individual visuals and distinguish time spent on DAX queries from visual display and other activity. That gives you evidence about which visuals deserve attention first.
For semantic-model and capacity problems, use the monitoring information available for your Power BI or Fabric environment. For source-side issues, inspect query execution in the database or warehouse rather than assuming Power BI is responsible.
The principle is simple: measure at the boundary between layers.
If a visual spends most of its time waiting on a query, changing its font or spacing will not solve the problem. If the DAX query is quick but rendering is slow, rewriting the warehouse query is unlikely to help.
2. Fix the semantic model before chasing individual visuals
A well-designed semantic model is one of the highest-leverage performance controls in Power BI.
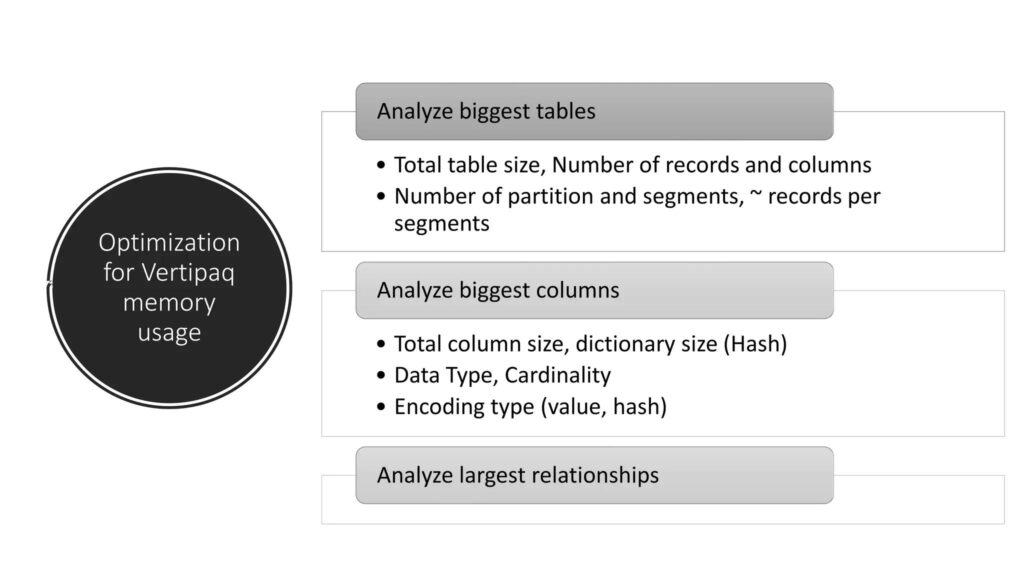
Large, unnecessarily complex models increase memory consumption and can make queries more expensive. Common causes include importing columns that are never used, retaining transaction-level detail when reports only need aggregated data, using high-cardinality text fields extensively, creating relationships that complicate filter propagation, and mixing multiple grains without a clear dimensional design.
A practical review should ask:
- Does every imported column support a report, calculation, relationship, security rule, or known analytical need?
- Is the fact table stored at the right grain for the decisions users make?
- Can descriptive attributes move into dimensions rather than being repeated across a large fact table?
- Are relationship directions intentional?
- Are date tables and key dimensions modeled consistently?
- Is a star-schema style model possible for the core reporting workload?
Model optimization is not about making the data model artificially small. It is about removing structural work that produces no analytical value.
This also improves maintainability. A model that is easier to understand is usually easier to test, govern, and optimize.
3. Treat DAX optimization as query engineering
DAX measures can look compact while doing substantial work.
The first priority is not to make every measure shorter. It is to identify expensive measures that are executed frequently or across large filter contexts.
Look closely at measures that:
- iterate large tables unnecessarily;
- repeatedly calculate the same intermediate result;
- use complex filters over high-cardinality columns;
- force calculations at a finer grain than the visual requires;
- contain nested logic that could be simplified;
- produce expensive totals because the total context behaves differently from individual rows.
Use variables when they improve clarity and avoid repeating the same expression. Push stable transformation logic upstream when it does not need to be calculated dynamically for every user interaction. Keep genuinely analytical logic in measures where filter context is part of the requirement.
The objective is not “move everything out of DAX.” It is to put each calculation in the layer where it can be executed efficiently and governed clearly.
4. Reduce visual query pressure
Every visual on a page has a cost.
A report page containing many cards, charts, matrices, slicers, custom visuals, and cross-highlighting interactions can generate substantial query activity from a single user action. A visually simple page can also be expensive if one matrix requests a large result set with complex measures.
Review:
- the number of visuals that query the model;
- whether decorative visuals are actually issuing queries;
- slicers with very large value lists;
- matrices with excessive rows or hierarchy expansion;
- visuals that request detail users rarely need;
- interactions that cause unrelated visuals to recalculate;
- custom visuals whose behavior is materially slower than native alternatives.
This is not an argument for empty dashboards. The objective is information density with purpose. Every visual should help the user understand performance, diagnose an exception, or take the next analytical step.
The same issue matters in embedded analytics. Actiknow’s guide to Power BI Embedded pricing notes that report design can affect infrastructure demand: expensive DAX, high-cardinality fields, unnecessary interactions, DirectQuery usage, and too many visuals can all increase the resources needed to serve users.
5. Choose Import and DirectQuery for the workload, not the label
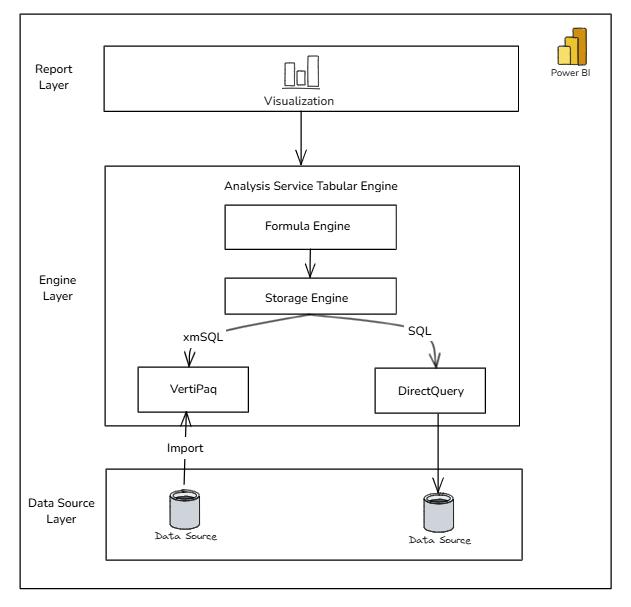
DirectQuery can sound attractive because data remains in the source and users can access fresher information. But every interactive query may depend on the performance, concurrency, network path, and availability of the underlying source.
Import mode shifts much of that work into the Power BI semantic model. It can deliver fast interactive performance, but it introduces refresh and model-size considerations.
Neither architecture is automatically better.
Ask:
- How fresh must the data actually be for the decision?
- How much data must the report expose?
- Can the source handle concurrent analytical queries?
- Are queries folding efficiently?
- Does the source have appropriate indexes, clustering, partitioning, or warehouse resources?
- Is the model small enough for the chosen capacity?
- What happens during source maintenance or network disruption?
Do not choose DirectQuery simply because someone requested “live data.” Define the required freshness in business terms first.
6. If DirectQuery is slow, investigate the source query
When a DirectQuery visual is slow, Power BI may be exposing a source-system problem rather than creating one.
Inspect the generated query and source execution plan where possible. Look for full scans, poorly selective filters, missing physical optimization, complex views, repeated transformations, joins across very large datasets, and concurrency limits.
Also inspect Power Query transformations. In supported scenarios, query folding allows transformations to be translated into source operations. A transformation that prevents effective folding can shift work into a less efficient path.
The BI team and database team should troubleshoot this together. Optimizing only one side of the boundary often moves the bottleneck instead of removing it.
7. Separate refresh optimization from interactive performance
A report can be fast for users and still take hours to refresh.
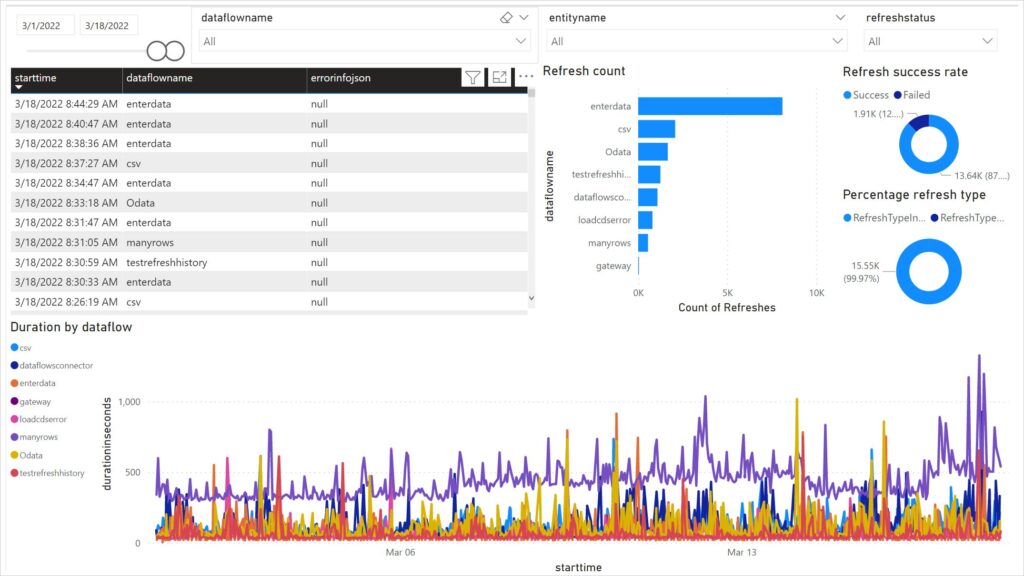
Refresh performance depends on source extraction, transformations, data volume, partitioning, gateway or network performance, model processing, and capacity availability.
For large models, incremental refresh can reduce repeated processing by limiting routine refresh work to the required partitions when the architecture and source support it. But incremental refresh is not a universal switch. The date strategy, source behavior, query folding, historical correction requirements, and change-detection logic all need to match the data.
Also ask whether every dataset needs the same refresh frequency. Refreshing a slowly changing reference dataset every 15 minutes wastes resources without improving decisions.
Refresh schedules should follow business freshness requirements rather than a blanket “as often as possible” policy.
8. Watch model size and cardinality
Columnar analytical engines compress some data patterns far more effectively than others.
A numeric category with a small set of repeating values behaves differently from a unique text identifier or timestamp with millions of distinct values. High-cardinality columns can consume significant model resources, especially when they are not needed for analysis.
Review identifiers, long text, precise timestamps, URLs, transaction references, and other near-unique fields. Some are essential for drill-through or audit workflows. Others may have been imported merely because they existed in the source.
Do not remove a field solely because it is high cardinality. Ask whether the reporting experience genuinely requires it inside the semantic model and at what grain.
9. Check row-level security in the real user context
Security can change query behavior.
A report that performs well for an administrator may behave differently for a regional manager or another restricted role. Complex security rules, large entitlement tables, dynamic user mappings, and inefficient relationships can all affect the path a query takes.
Test performance as representative roles, not only as the developer.
This is particularly important in customer-facing and multi-region analytics. Actiknow’s guide to multi-tenant analytics security explains why authorization needs to be designed across the application, semantic model, and data boundary. Performance testing should use the same realistic security context.
Never remove a required security control merely to make a report faster. Optimize the security architecture while preserving the access rule.
10. Do not use capacity upgrades as the first fix
More capacity can solve a genuine resource constraint. It can also make inefficient design more expensive.
Before increasing capacity, establish:
- whether the workload is actually capacity-bound;
- whether slow queries are concentrated in one model or report;
- whether refreshes overlap with peak interactive usage;
- whether inefficient DAX or source queries dominate execution;
- whether concurrency has grown beyond the original architecture;
- whether background workloads are competing with report users.
If a capacity increase is justified, you should be able to explain what resource constraint it addresses and what improvement you expect to observe.
That turns an infrastructure purchase into a measured engineering decision.
A practical order for fixing a slow Power BI report
Performance investigations become much faster when teams follow a consistent order.
First, reproduce and measure the specific slow interaction.
Second, identify the expensive visual or query.
Third, inspect the semantic model and relationships.
Fourth, review the DAX used by the slow visual.
Fifth, reduce unnecessary visual and interaction workload.
Sixth, if the model uses DirectQuery, inspect query folding and source execution.
Seventh, test with the actual security role and representative data volume.
Eighth, inspect capacity and concurrency after inefficient design has been ruled out.
For refresh problems, run a parallel diagnostic path covering extraction, transformations, folding, partitions, gateways, source capacity, and refresh scheduling.
This order prevents teams from beginning with the most expensive remedy.
Performance needs a baseline and a regression test
Optimization is incomplete if nobody records what “good” means.
For important reports, maintain a small set of performance scenarios such as:
- initial page load;
- changing a primary date filter;
- applying a common business slicer;
- drilling from summary to detail;
- opening a high-volume matrix;
- refreshing the semantic model.
Record representative timings and the test conditions. Repeat the checks after major model changes, new measures, source migrations, security changes, or significant data growth.
This turns performance from an occasional emergency into an engineering control.
What business leaders should ask the BI team
Executives do not need to debug DAX, but they should expect precise answers to a few questions.
- Which reports or interactions are outside the agreed performance target?
- Where is the time being spent: source, model, DAX, rendering, network, or capacity?
- What evidence supports the proposed fix?
- Will the fix change data freshness, security, functionality, or cost?
- How will we verify that performance remains acceptable as data and usage grow?
Those questions encourage disciplined diagnosis rather than endless dashboard tweaking.
Frequently asked questions
What is a reasonable Power BI report load time?
There is no universal number that fits every report. Establish targets based on the interaction and user need. A frequently used executive summary should generally have a tighter target than an occasional detailed analytical query. What matters operationally is having a measurable baseline and detecting regressions.
Does reducing the number of visuals always make Power BI faster?
No. It can reduce query and rendering work, but one expensive visual or measure may dominate the page. Use performance measurements to identify the actual bottleneck.
Is DirectQuery slower than Import mode?
DirectQuery introduces a dependency on source-query performance and network latency, while Import uses an in-memory semantic model and requires refresh. Either can be appropriate depending on freshness, scale, source capability, and workload. Architecture should follow requirements rather than a blanket rule.
Can bad DAX make a Power BI report slow?
Yes. Measures are executed in response to report queries, and inefficient logic can materially affect interaction time. Focus optimization on measures that are both expensive and frequently used.
Will upgrading Power BI or Fabric capacity fix slow reports?
It can help when capacity resources or concurrency are the constraint. It will not automatically correct inefficient models, DAX, source queries, or report design. Measure the bottleneck before increasing capacity.
Does Power BI performance optimization require rebuilding the report?
Usually not. Many improvements come from targeted changes to the model, measures, source queries, visuals, refresh design, or workload configuration. Rebuilding should be considered only when the existing architecture itself prevents a reasonable solution.
Need help diagnosing Power BI performance?
If your Power BI environment has become slow as data volumes, report complexity, or user adoption have grown, Actiknow can help assess the reporting path from data source and semantic model through DAX, report design, refresh, and deployment. Contact Actiknow to discuss the specific bottlenecks affecting your BI environment.