

A sales forecast should answer a simple executive question: how much revenue are we reasonably likely to close, and when?
Yet many forecasts do something much less useful. They add up open opportunities, multiply them by stage probabilities, and present the result as if it were a prediction. The arithmetic may be correct while the forecast itself is unreliable.
The problem is rarely the dashboard. It is usually the operating data underneath it.
A credible sales pipeline forecast depends on consistent opportunity stages, realistic close dates, historical conversion behavior, clear treatment of slipped deals, and reconciliation between CRM definitions and the numbers Finance uses to run the business. If those foundations are weak, adding more sophisticated analytics simply produces a more polished version of the same uncertainty.
For CEOs, CROs, CFOs, and RevOps leaders, the goal should therefore not be to create the most complicated forecasting model. It should be to create a forecast whose assumptions are visible, measurable, and capable of improving over time.
What Sales Pipeline Forecasting Actually Needs to Predict
Before choosing a model, define the output.
A pipeline forecast can mean several different things:
- Bookings expected to close this month or quarter
- Contracted annual recurring revenue
- Recognized revenue
- New-logo revenue only
- New business plus expansion
- Gross sales before cancellations or returns
- Cash expected to be collected
These are not interchangeable.
A CRM opportunity may be considered won when a contract is signed. Finance may recognize revenue over twelve months. Cash may arrive 30 or 60 days later. If the executive team says “forecast” without agreeing which event is being forecast, Sales and Finance can both produce correct numbers that disagree.
Start with one explicit definition. For example: “Expected new and expansion bookings with a contractual close date in the current quarter.” Then document what is included and excluded.
Actiknow’s Salesforce services include Salesforce integration and consulting, while its Business Intelligence practice covers integration of data from databases and APIs into reporting solutions. Those capabilities are relevant when CRM forecasting has to extend beyond a single Salesforce report and reconcile with other business systems.
Why the Standard Weighted Pipeline Formula Is Not Enough
The familiar formula is straightforward:
Weighted pipeline = Opportunity amount × stage probability
If a $100,000 opportunity is in a stage assigned a 60% probability, it contributes $60,000 to weighted pipeline.
This is useful as a summary measure. It is not automatically a reliable forecast.
The formula assumes that the probability assigned to a stage reflects actual closing behavior. In many organizations, it does not.
A stage called “Proposal” may have a nominal probability of 60%, while historical data shows that only 32% of opportunities entering that stage eventually close. The opposite can also happen. A mature sales team may consistently convert 75% of opportunities at a stage configured as 50%.
Stage probability can also conceal differences by:
- Product or service line
- New business versus expansion
- Enterprise versus SMB accounts
- Geography
- Lead source
- Deal size
- Sales representative
- Opportunity age
- Quarter-end behavior
The solution is not necessarily to replace CRM probabilities with an opaque algorithm. A better first step is to measure what actually happens.
1. Fix Stage Hygiene Before Building a Forecast Model
Forecast accuracy starts with pipeline hygiene.
An opportunity stage should represent an observable commercial milestone, not a salesperson’s feeling about whether a deal is going well.
Weak stage definitions look like this:
- Interested
- Hot
- Very likely
- Almost there
Stronger definitions are based on evidence:
- Discovery completed
- Qualified problem and budget confirmed
- Solution presented
- Commercial proposal submitted
- Procurement or legal review underway
- Contract sent for signature
Each stage should have entry and exit criteria. If two salespeople can look at the same deal and reasonably put it in different stages, the forecast inherits that ambiguity.
Executives should ask three questions for every important stage:
- What must be true before a deal enters this stage?
- What evidence shows that condition is true?
- What event moves the deal to the next stage?
This also makes CRM adoption easier to evaluate. Instead of telling representatives to “keep Salesforce updated,” management can define the specific information required for a deal to remain in the forecast.

2. Treat Close Dates as Data, Not Wishes
The expected close date is one of the most important and frequently abused fields in pipeline forecasting.
A quarter-end forecast can be materially overstated when opportunities retain close dates that nobody realistically expects to meet.
Track close-date movement historically. Useful measures include:
- Percentage of open opportunities whose close date has moved at least once
- Average number of close-date changes before win or loss
- Average number of days a deal slips
- Percentage of current-quarter pipeline that originally belonged to an earlier quarter
- Win rate for deals that have slipped once, twice, or three times
A $500,000 opportunity expected to close this month is not equally credible if its close date has already moved four times.
Do not automatically remove slipped deals. Use the behavior as information.
3. Measure Historical Stage Conversion
For each opportunity cohort, calculate how frequently deals progress, stall, close, or disappear.
At minimum, measure:
- Stage-to-stage conversion rate
- Stage-to-win rate
- Median days in each stage
- Overall sales-cycle length
- Loss rate
- No-decision rate where identifiable
Historical conversion should preferably be based on the opportunity’s state at a point in time, not only its final state today.
This distinction matters. If an opportunity currently marked Closed Won once spent 40 days in Proposal, a snapshot-based history lets you analyze what was knowable while the opportunity was still open. Looking only at today’s CRM record can introduce hindsight into the model.
4. Build Cohorts That Reflect Material Differences
One company-wide win rate is usually too broad.
Suppose the business sells a $20,000 standard implementation and a $500,000 enterprise transformation. Combining those opportunities into one probability model may distort both.
Segment only where historical evidence supports meaningful differences. Common dimensions include:
- New logo versus existing customer
- Product or service family
- Deal-size band
- Region
- Acquisition channel
- Sales motion
- Customer segment
Avoid slicing data until every cohort contains too few deals to be meaningful. The purpose of segmentation is to reveal repeatable behavior, not manufacture precision.

5. Separate Pipeline Coverage From Forecast
Pipeline coverage and forecast are related but different.
Pipeline coverage asks whether there is enough potential opportunity to achieve the target. A business with a $1 million quarterly target and $3 million of qualified pipeline has 3x coverage.
Forecasting asks how much of that pipeline is expected to close in the relevant period.
A company can have excellent pipeline coverage and a weak forecast if deals are early-stage, aging, repeatedly slipping, or concentrated in a few large opportunities.
Executive reporting should therefore show both.
Useful views include:
- Target
- Total open pipeline
- Qualified pipeline
- Weighted or modeled forecast
- Sales management commit
- Closed-won to date
- Remaining gap to target
The gap between these numbers is often more informative than any single number.
6. Measure Forecast Bias, Not Just Forecast Error
Forecast accuracy tells you how far the prediction was from the outcome.
Forecast bias tells you whether the organization tends to miss in one direction.
If quarterly forecasts repeatedly overstate actual bookings by 15%, the business has an optimism bias. If they consistently understate performance, sales managers may be sandbagging or the model may systematically undervalue late-stage deals.
Track both:
Forecast error = Forecast minus actual
Forecast bias = Direction and persistence of that error across periods
A forecasting process should improve as the organization learns from these errors.
For example, compare the forecast issued 90, 60, 30, and 7 days before quarter end with the final result. This creates a forecast-accuracy curve and shows when the business actually becomes predictable.
7. Reconcile CRM Forecasts With Finance
This is where a technically correct sales dashboard can lose executive trust.
CRM and Finance often disagree because they answer different questions or use different rules.
Common causes include:
- Opportunity amount versus invoiced amount
- Contract date versus revenue-recognition date
- Gross versus net revenue
- Currency conversion rules
- Cancellations and credits
- Multi-year contracts
- Expansion and renewal classification
- Taxes or pass-through charges
- Duplicate opportunities
- Different fiscal calendars
Create an explicit reconciliation layer.
For closed-won deals, regularly compare CRM bookings with the corresponding finance records. Exceptions should be visible and categorized rather than silently corrected in a spreadsheet.
This does two things. First, it protects executive reporting. Second, it reveals process problems upstream, such as inconsistent account IDs, missing contract values, or deals marked won before the commercial event Finance recognizes.

When reporting requires combining CRM, finance, marketing, operational, or product data, a governed BI architecture can be more reliable than repeatedly exporting and joining spreadsheets. Actiknow’s Business Intelligence services cover data integration, solution architecture, modeling, dashboards, publishing, and refresh mechanisms across BI tools including Power BI, Tableau, and Looker Studio.
8. Keep Management Judgment, but Measure It
A model should not pretend that the CRM contains every piece of relevant information.
A sales leader may know that a customer’s board meeting was postponed, a procurement process is blocked, or a verbal commitment is stronger than the structured fields suggest.
Management judgment can therefore be valuable. The mistake is allowing judgment to overwrite the data without leaving an audit trail.
Keep separate fields or measures for:
- Model forecast
- Rep forecast
- Manager forecast
- Commit
- Best case
Then measure each against actual outcomes.
Over time, you can answer questions such as:
- Which forecast is most accurate at 30 days before quarter end?
- Which teams systematically over-commit?
- Does management override improve or reduce accuracy?
- Which types of opportunities are consistently misjudged?
Judgment becomes another measurable signal rather than an unexplained adjustment.
9. Design the Executive Dashboard Around Decisions
A forecasting dashboard should not simply display every CRM metric available.

For a CEO, CFO, or CRO, a useful top-level view normally needs to answer:
- What have we already closed?
- What are we forecasting?
- How does that compare with target?
- How has the forecast changed since the previous review?
- Which deals account for the largest movement?
- How much pipeline has slipped?
- Where is forecast risk concentrated?
- How accurate have previous forecasts been?
Drill-down views can then explain the drivers by region, product, team, stage, cohort, or opportunity.
The dashboard should make changes visible. A forecast of $4.2 million means more when executives can see that it fell from $4.8 million last week because two enterprise opportunities slipped into the next quarter.
10. Create a Forecasting Cadence
A reliable forecast is a management process supported by data, not a dashboard refreshed in isolation.
A practical weekly cadence might include:
- Freeze or snapshot the pipeline at a defined time
- Refresh source data and validation checks
- Compare the new forecast with the previous snapshot
- Review large movements and stale opportunities
- Review exceptions between CRM and Finance
- Record management overrides separately
- Publish the agreed forecast and assumptions
At month or quarter end, compare the snapshots with actual results and document why the forecast missed.
This feedback loop is what turns forecasting from reporting into organizational learning.
A Practical Forecasting Architecture
The exact architecture depends on scale, but the logical flow is straightforward.
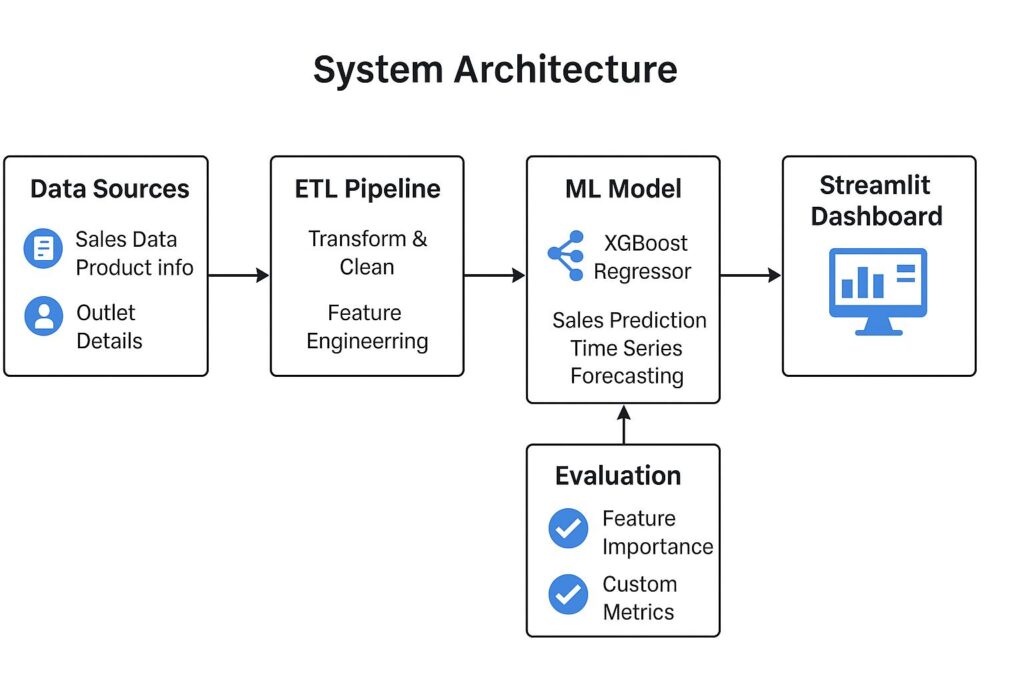
Source layer: CRM opportunities, accounts, activities, users, products, and relevant finance data.
Historical layer: periodic opportunity snapshots or field-history data that preserve how stages, amounts, and close dates changed.
Transformation layer: standardized currencies, fiscal periods, stage mappings, cohort definitions, exclusions, and finance reconciliation rules.
Forecast layer: historical conversion measures, pipeline coverage, weighted forecasts, management categories, and accuracy metrics.
Presentation layer: executive dashboards plus operational drill-down for Sales and RevOps.
For organizations using Salesforce, the platform may remain the operational system of record for opportunities while the analytical model is built outside it. Actiknow’s Salesforce offering explicitly includes Salesforce integration with other systems, and its BI practice supports integration from databases and APIs. That combination can be useful when a forecast requires a broader view than CRM alone provides.
What to Measure Before Adding Machine Learning
Machine learning can eventually improve forecasting for organizations with sufficient clean historical data. It should not be the first response to unreliable pipeline information.
Before considering a predictive model, establish a baseline using simpler measures:
- Historical stage-to-win conversion
- Days in stage
- Opportunity age
- Close-date slippage
- Deal size
- Segment or product cohort
- Rep and manager forecast categories
- Previous forecast accuracy
If these basic measures are not trustworthy, a more advanced model will inherit the same weaknesses and become harder to explain.
The executive question is not “Are we using AI?” It is “Does this method predict the business better than the baseline, and can we understand when it fails?”
A 30-Day Improvement Plan
Week 1: Define the forecast
Agree on the event being forecast, time horizon, inclusions, exclusions, target, and Finance definition.
Week 2: Audit CRM hygiene
Review stages, close dates, stale opportunities, missing amounts, duplicates, and historical field availability.
Week 3: Establish the baseline
Calculate conversion rates, sales-cycle metrics, pipeline coverage, slippage, and previous forecast error.
Week 4: Build the review process
Create the executive view, define weekly snapshots, document overrides, reconcile closed-won deals with Finance, and begin measuring forecast accuracy.
Do this before spending months on a sophisticated forecasting engine. Many organizations can materially improve decision quality simply by making assumptions and historical behavior visible.
Questions Executives Should Ask About the Forecast
A strong forecast should survive questions such as:
- What exactly does this number represent?
- What portion is already closed versus still open?
- Which assumptions have changed since last week?
- How much of this quarter’s pipeline has slipped from earlier periods?
- What historical evidence supports our stage probabilities?
- How concentrated is the forecast in the five largest deals?
- What would the forecast be without management overrides?
- How accurate were our 30-day forecasts over the last four quarters?
- Can every closed-won CRM amount be reconciled to Finance?
- Which data-quality problems could materially change this number?
If the forecasting process cannot answer these questions, the priority should be improving the foundation rather than adding more visualizations.
Frequently Asked Questions
What is sales pipeline forecasting?
Sales pipeline forecasting estimates how much business is likely to close during a future period using current opportunities, historical conversion behavior, timing, and management information. It differs from simply reporting the total value of open opportunities.
How do you calculate a sales pipeline forecast?
A basic approach multiplies opportunity value by a probability of closing. A more reliable process calibrates probabilities against historical outcomes and also considers factors such as stage, opportunity age, close-date slippage, segment, deal size, and forecast horizon.
What is a good sales pipeline coverage ratio?
There is no universal ratio. Required coverage depends on actual win rates, sales-cycle length, deal mix, pipeline quality, and how much of the period has elapsed. A business should derive coverage expectations from its own historical conversion behavior rather than adopt a generic benchmark.
Why is our CRM forecast different from Finance?
Common causes include different definitions of bookings and revenue, contract versus recognition dates, currency treatment, credits, cancellations, multi-year agreements, and data-quality issues. The solution is an explicit reconciliation process rather than forcing one system’s number to match the other without explanation.
Should sales forecasting use AI or machine learning?
Only when it demonstrably improves prediction over a transparent baseline and the organization has sufficient reliable historical data. Stage hygiene, opportunity history, close-date behavior, and reconciliation should usually be fixed first.
How often should a sales forecast be updated?
The cadence should match the decisions being made. Weekly forecasting is common for active sales management, while some high-velocity businesses need more frequent updates. More refreshes do not improve the forecast if the underlying CRM data is not being maintained.
What CRM data is most important for forecasting?
Opportunity amount, stage, stage history, expected close date and its history, creation date, win/loss outcome, account and segment attributes, owner, product or service, and forecast category are common foundations. The exact fields depend on the sales process.
How can executives know whether a forecast is improving?
Track forecasts at consistent horizons, such as 90, 60, 30, and 7 days before period end, and compare them with actual outcomes. Measure both absolute error and persistent directional bias.
Final Takeaway
Reliable sales pipeline forecasting is less about finding a magical probability formula and more about making commercial uncertainty measurable.
Define what is being forecast. Make opportunity stages evidence-based. Preserve historical changes. Measure real conversion behavior. Treat close-date slippage as information. Separate pipeline coverage from forecast. Reconcile CRM with Finance. Preserve management judgment, but measure whether it improves the result.
Once those controls are in place, the organization can make forecasting progressively more sophisticated without losing explainability.
If your forecasting challenge spans CRM data, other business systems, and executive reporting, Actiknow can help assess the data flow and reporting architecture. Contact Actiknow to discuss the current process and determine whether the problem is best addressed through Salesforce integration, BI modeling, dashboarding, or a combination of these capabilities.