

A Tableau-to-Power-BI migration is not a dashboard conversion project
Moving from Tableau to Power BI can look deceptively simple from a distance. Both platforms connect to data, model information, calculate metrics, and produce interactive dashboards. That can lead organizations to frame the project as a report-by-report rebuild: count the Tableau workbooks, recreate them in Power BI, validate the numbers, and switch users over.
That approach usually underestimates the real work.
A BI platform contains years of accumulated business logic, data-source decisions, calculated fields, permissions, extracts, subscriptions, hidden dependencies, user habits, and reporting exceptions. Some of that logic belongs in the new platform. Some should move upstream into a data warehouse or semantic model. Some reports should be consolidated. Others may no longer be used at all.
The migration is therefore an opportunity to simplify the reporting estate, but only if the organization audits what it has before deciding what to rebuild.
Actiknow’s business intelligence services cover both Power BI and Tableau, along with data-source integration, solution architecture, implementation, publishing, and refresh mechanisms. That end-to-end view is important in a migration because the dashboard is only the visible layer of a larger reporting system.
1. Start with a usage inventory, not a workbook count
The first migration number executives often receive is the number of Tableau workbooks or dashboards. It is useful, but it is not a scope.
A workbook that nobody opens should not receive the same migration priority as a dashboard used in a weekly executive meeting. A small dashboard may contain difficult calculations and security logic. A visually complex report may rely on a simple, reusable dataset and be relatively straightforward to rebuild.
Create an inventory that captures at least:
- workbook and dashboard name;
- business owner;
- intended audience;
- active user count or recent usage where available;
- frequency of use;
- underlying data sources;
- extract or live-connection behavior;
- refresh schedule;
- calculated fields and parameters;
- security or user filtering;
- subscriptions, alerts, or exports;
- downstream dependencies;
- business criticality;
- candidate disposition: migrate, consolidate, redesign, replace, or retire.
This is the first place to reduce migration cost. Do not spend money faithfully reproducing reporting assets the business no longer needs.

2. Identify the business-critical dashboards first
Migration sequencing should follow business risk, not alphabetical order.
Classify reports by what happens if they are unavailable or wrong. Executive performance reporting, financial reporting, sales pipeline management, operational monitoring, customer-facing analytics, and regulatory or contractual outputs deserve more rigorous validation than exploratory dashboards used by a small analyst group.
For critical reports, document the decisions they support and the metrics users treat as authoritative. That creates a clear acceptance test later.
Actiknow’s business intelligence dashboard work emphasizes integration, testing, optimization, deployment, training, and ongoing support. Those same stages are useful for migration planning because a dashboard is only complete when users can rely on it in the operating workflow, not merely when it renders in Power BI.
3. Audit data sources before rebuilding visualizations
A migration is often the wrong time to preserve every historical data-access pattern.
Tableau workbooks may connect directly to databases, published data sources, spreadsheets, extracts, cloud warehouses, APIs, or files maintained by individual teams. Over time, two dashboards that appear to show the same KPI may obtain it through different paths.
Before rebuilding, map:
source system → ingestion or connection → transformation → analytical dataset → calculation → visual.
Then ask whether Power BI should reproduce that chain or improve it.
If several Tableau workbooks repeat the same transformations, the migration may justify centralizing those rules in a warehouse, dataflow, semantic model, or another governed layer. If a workbook depends on a manually maintained spreadsheet, the team should decide whether that dependency is acceptable in the future architecture.
The goal is not to change everything during migration. It is to avoid accidentally institutionalizing known weaknesses for another five years.

4. Treat calculated-field parity as a business-logic exercise
Tableau calculations and Power BI DAX are not interchangeable languages.
A direct syntax translation can miss differences in evaluation context, aggregation behavior, table calculations, level-of-detail expressions, filtering order, null handling, dates, and totals. Even when two calculations appear conceptually similar, the resulting number must be tested in the contexts where users actually consume it.
Build a calculation inventory for material metrics.
For each important calculation, record:
- business definition;
- Tableau expression;
- source fields;
- aggregation level;
- filter dependencies;
- expected behavior at row, subtotal, and total levels;
- time-intelligence behavior;
- Power BI implementation;
- validation examples.
Where possible, move stable business logic out of individual reports and into a reusable governed layer. Power BI semantic models can then expose consistent measures across multiple reports rather than allowing each report author to redefine the KPI.
The migration is successful when business meaning is preserved, not when every Tableau formula has a DAX formula with a similar name.
5. Reconcile filters, parameters, and user interactions
Users experience BI through interaction, not through screenshots.
Tableau dashboards may use filters, parameters, sets, actions, highlighting, drill paths, navigation, tooltips, and custom interaction patterns. Power BI offers its own mechanisms, but the experience will not always map one-to-one.
For every high-value report, document the workflows users rely on.
- Can a regional leader move from a company total to a territory and then to an account?
- Can finance switch between actual, budget, and forecast?
- Can a sales manager choose a reporting period and export the filtered detail?
- Does selecting one chart filter the rest of the page?
- Does a parameter alter a calculation rather than merely filter records?
Recreate the business workflow, not necessarily the exact Tableau interaction. A Power BI-native approach may be simpler or more maintainable than forcing visual parity.
6. Rebuild permissions deliberately
Do not assume security migrates with the dashboard.
Tableau projects, sites, groups, workbook permissions, data-source permissions, and user filters may have evolved over years. Power BI uses a different combination of workspaces, apps, semantic-model permissions, sharing controls, Microsoft Entra identities, and row-level security.
Inventory who can see what today and determine whether that access is intentional.
Pay particular attention to:
- regional data restrictions;
- departmental access;
- executive-only reports;
- customer-specific data;
- personally identifiable or commercially sensitive fields;
- export permissions;
- build permissions on shared semantic models;
- external users;
- service identities and refresh credentials.
A migration is a good point to remove obsolete access, but changes should be approved rather than accidental.
Security testing should include representative users from each important role. An administrator seeing the correct data does not prove that a restricted user sees only the correct data.

One of the largest opportunities in a Tableau-to-Power-BI migration is reducing repeated business logic.
If dozens of workbooks independently calculate revenue, active customers, pipeline, margin, or headcount, rebuilding each one independently in Power BI simply recreates the governance problem.
Identify common analytical domains and decide where reusable semantic models make sense.
A shared model can centralize:
- dimensions and relationships;
- certified measures;
- calendar logic;
- security rules;
- commonly used hierarchies;
- reusable calculations;
- naming conventions.
Do not create one enormous model simply for centralization. The model boundaries should reflect data relationships, security, refresh requirements, ownership, and workload.
The objective is controlled reuse.
8. Audit performance assumptions
A Tableau dashboard that performs acceptably does not guarantee that its Power BI replacement will perform the same way.
The platforms have different engines, storage modes, modeling patterns, calculation languages, caching behavior, and infrastructure choices. Performance therefore needs its own migration acceptance criteria.
Record baseline behavior for important Tableau dashboards before cutover. Measure representative tasks such as initial load, applying common filters, drilling to detail, and opening large tables.
Then test the equivalent Power BI workflow with realistic data volumes and security roles.
Investigate the full path when performance is poor: source queries, data transformations, semantic-model design, DAX, storage mode, visual count, network behavior, and capacity.
Do not wait until user acceptance testing to discover that the new executive dashboard takes substantially longer to respond.
9. Review refresh and operational dependencies
Reports are not useful if their data does not arrive.
Inventory Tableau extracts, live connections, refresh schedules, credentials, gateways, source-system windows, and failure notifications. Then design the equivalent Power BI operating model.
Ask:
- Who owns each refresh?
- Which reports have freshness commitments?
- Are on-premises sources involved?
- Is a gateway required?
- What happens when a refresh fails?
- Who receives the alert?
- Can the previous successful dataset continue serving users safely?
- Are upstream pipelines synchronized with semantic-model refreshes?
- What is the recovery process?
Migration plans frequently focus on build effort and under-budget the operating model. The platform change is not finished until support responsibilities are clear.
10. Model licensing and capacity before committing to the target architecture
Platform cost is more than the price of an authoring license.
The final Power BI cost depends on how content is distributed, the number and type of users, external sharing requirements, embedded use cases, Fabric or Power BI capacity choices, workload characteristics, and the broader Microsoft environment.
Do not compare Tableau and Power BI using only headline license prices.
Build a total-cost view that includes:
- user licensing;
- capacity where applicable;
- migration engineering;
- data-platform changes;
- gateway and infrastructure requirements;
- administration;
- support and monitoring;
- training;
- parallel-run period;
- ongoing enhancement effort.
Some migration benefits may come from consolidating tools or fitting the Microsoft ecosystem better. Others may come from simplifying the reporting estate itself. Keep those benefits separate so the business case remains defensible.
11. Plan adoption as part of the migration
A technically correct Power BI report can still fail if users continue exporting data and rebuilding their old workflow manually.
Tableau users have learned specific navigation patterns, terminology, subscriptions, and self-service behaviors. Analysts may also have different development workflows and governance expectations in Power BI.
Identify user groups early:
- report consumers;
- executives;
- operational managers;
- power users;
- analysts;
- report developers;
- platform administrators.
Training should focus on how each group works, not on a generic product tour.
For consumers, explain where trusted reports live and how to filter, drill, subscribe, and export.
For analysts, cover semantic models, measure ownership, publishing standards, workspace governance, and the process for requesting new data.
For administrators, document access, refresh, monitoring, deployment, and support.
Actiknow’s data visualization services describe migration as a process spanning requirements, data preparation and integration, dashboard development, testing, deployment, training, and support. That is a useful reminder that adoption is part of delivery rather than a post-project communication exercise.

12. Use a phased cutover instead of a big-bang switch
Running both platforms forever is expensive and confusing. Turning Tableau off immediately after the first Power BI release is risky.
Use a controlled overlap.
A practical sequence is:
- Phase 1: inventory and rationalize the Tableau estate.
- Phase 2: establish Power BI architecture, governance, semantic-model patterns, and development standards.
- Phase 3: migrate a representative pilot containing meaningful data complexity, calculations, permissions, and user workflows.
- Phase 4: reconcile the pilot against agreed Tableau outputs and source data.
- Phase 5: migrate reports in business-priority waves.
- Phase 6: run critical reports in parallel for a defined validation period.
- Phase 7: obtain owner sign-off and retire the corresponding Tableau assets.
- Phase 8: remove unused licenses, extracts, schedules, credentials, and infrastructure only after dependencies are confirmed.
Each wave should have a named owner and exit criteria.
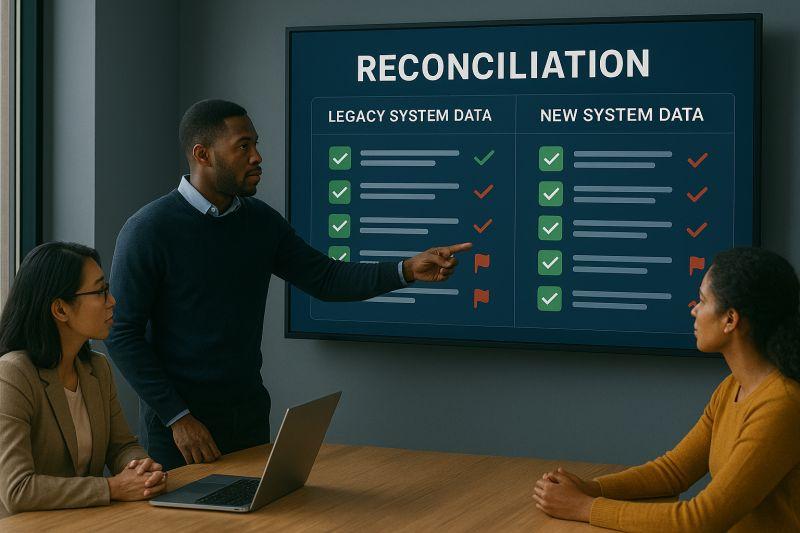
13. Define reconciliation before user acceptance testing
“Looks right” is not a validation strategy.
For every critical report, identify the Tableau outputs and source-system totals against which Power BI will be reconciled. Compare not only grand totals but also useful segments such as month, region, product, customer type, stage, or department.
When differences occur, classify them.
A difference may be caused by:
- a genuine migration defect;
- different filters;
- a calculation translation issue;
- changed source data;
- refresh timing;
- permissions;
- a historical Tableau defect that should not be reproduced;
- an intentionally improved business definition.
Maintain an exception log and require business owners to approve intentional differences.
This avoids a common migration failure: teams spending weeks trying to reproduce an old number that nobody can explain.
14. Retire Tableau assets with the same discipline used to create Power BI
Decommissioning deserves its own checklist.
Before removing a Tableau asset, confirm:
- the replacement has been approved;
- users know where to find it;
- subscriptions or scheduled outputs have replacements;
- downstream consumers have migrated;
- historical access requirements are covered;
- data extracts are no longer required;
- service accounts and credentials can be removed;
- licenses can be reclaimed;
- support documentation points to the new environment.
Do not leave duplicate reporting systems active indefinitely “just in case.” Parallel systems create competing definitions and undermine the governance benefits of migration.
A practical pre-migration audit checklist
Before committing to a Tableau-to-Power-BI migration plan, confirm that you can answer these questions:
- Which Tableau dashboards are actively used?
- Which reports are business critical?
- Who owns each important metric?
- Which dashboards can be retired or consolidated?
- What data sources and transformations sit behind each report?
- Which calculated fields require business-level validation?
- Which Tableau interactions are essential to user workflows?
- What permissions and user filters must be reproduced?
- Which metrics should move into shared Power BI semantic models?
- What are the current performance baselines?
- What refresh schedules and operational dependencies exist?
- What licensing and capacity model will Power BI require?
- Which user groups need training?
- How long will critical reports run in parallel?
- Who signs off reconciliation?
- What are the criteria for shutting down the corresponding Tableau assets?
If several of these questions cannot be answered, the organization is not yet ready to estimate the migration accurately.
What executives should expect from the migration plan
A credible migration proposal should provide more than a dashboard count and delivery date.
It should show the current reporting estate, rationalization assumptions, target architecture, migration waves, calculation and security risks, validation approach, adoption plan, operating model, licensing assumptions, and decommissioning criteria.
It should also distinguish known scope from discovery risk. If hundreds of calculated fields or poorly documented data sources have not yet been reviewed, the plan should say so rather than presenting false precision.
That transparency makes the project easier to govern and reduces unpleasant surprises after development starts.
Frequently asked questions
Can Tableau dashboards be automatically converted to Power BI?
There is no universal one-click conversion that removes the need for design and validation. Data models, calculations, permissions, interactions, and visual behavior differ between the platforms. Automation may assist parts of inventory or development, but material reports still require reconciliation.
Should every Tableau dashboard be rebuilt in Power BI?
No. Migration is a good opportunity to retire unused reports, consolidate duplicates, and redesign workflows that no longer serve the business. Usage and business criticality should drive the decision.
How do Tableau calculated fields translate to Power BI?
Many business calculations can be recreated, but Tableau calculations and DAX have different evaluation concepts. Material metrics should be translated based on their business definition and validated across filters, totals, and edge cases.
How long should Tableau and Power BI run in parallel?
There is no fixed period that suits every organization. Critical reports should overlap long enough to complete reconciliation, user acceptance, operational testing, and owner sign-off. Less critical reports may require a shorter validation window.
What is the biggest risk in a Tableau-to-Power-BI migration?
A major risk is treating the project as visual reconstruction while overlooking embedded business logic, security, data dependencies, and user workflows. Those hidden dependencies are why the pre-migration audit matters.
Can we redesign dashboards during migration?
Yes, but separate intentional redesign from migration defects. Document what is changing and why, preserve agreed business definitions, and obtain owner approval for material changes.
Do we need to move our data warehouse when we move from Tableau to Power BI?
Not necessarily. BI-platform migration and data-platform migration are separate decisions. Changing both simultaneously can be justified, but it increases scope and validation risk. Evaluate the warehouse architecture on its own requirements.
A safer way to approach the move
A Tableau-to-Power-BI migration should leave the organization with more than equivalent dashboards. Done well, it creates a cleaner reporting estate, clearer metric ownership, more reusable data models, intentional security, and an operating model the team can support.
The first deliverable should therefore be an audit, not a rebuild.
If your organization is evaluating a Tableau-to-Power-BI migration, Actiknow can help assess the existing BI estate, data dependencies, target architecture, dashboard rebuild, validation, and rollout plan. Contact Actiknow to discuss the migration scope before committing to a report-by-report conversion.