

A CEO dashboard should not be a prettier version of the monthly management pack. Its job is to make the state of the business legible quickly enough that leaders can decide where to intervene, what to investigate, and what not to overreact to.
That distinction matters. Modern BI tools can put hundreds of measures on a screen. Actiknow’s Business Intelligence practice works across Power BI, Tableau, Looker Studio and other reporting tools, integrating information from databases and APIs. But the technology is only the delivery mechanism. The harder executive question is what deserves to be on the dashboard in the first place.
The best CEO dashboards are deliberately selective. They combine outcomes with leading indicators, show enough context to distinguish signal from noise, and make ownership clear. The exact metrics vary by business model, but the logic used to choose them is remarkably consistent.
What a CEO dashboard is actually for
A useful executive dashboard should help answer four questions:
- Are we on plan?
- Where is performance changing materially?
- What is likely to happen next?
- Which issue requires management attention?
If a metric does not contribute to one of those questions, it probably belongs in an operational or functional dashboard instead.
This is why a CEO dashboard should not attempt to replace the finance pack, CRM, marketing analytics, operational reporting or departmental BI. It should sit above them. Executives see the signal first and drill into the underlying analysis when necessary.
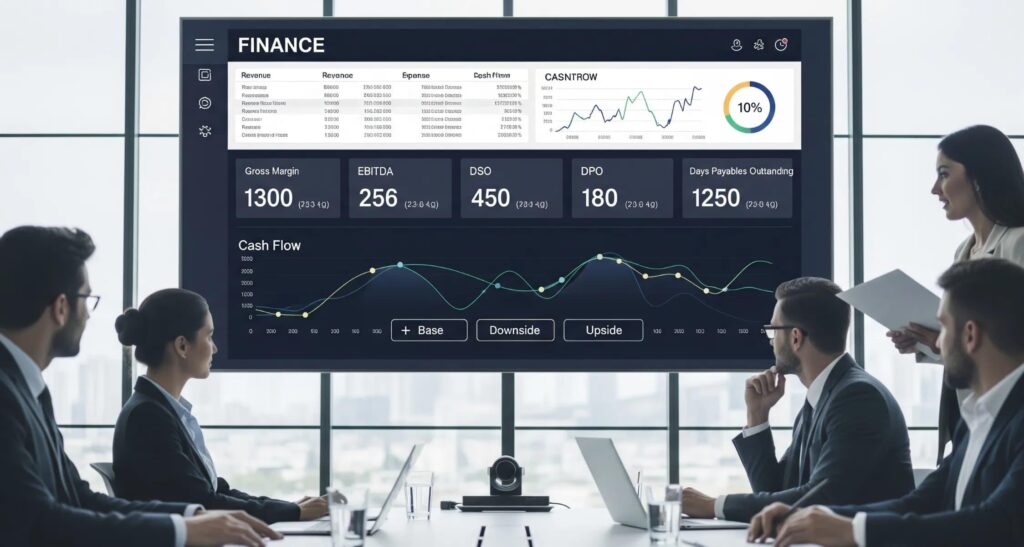
12 CEO dashboard metrics worth considering
There is no universal set of twelve metrics. A subscription software company, retailer, professional-services firm and manufacturer have different economics. The following measures are therefore a decision framework, not a template to copy blindly.
1. Revenue
Revenue remains the most obvious headline measure, but a standalone number is weak. Show actual revenue against plan and prior period, with an appropriate trend.
The executive question: Are we growing at the rate we expected, and where is the variance coming from?
Depending on the business, useful cuts may include geography, product, channel, customer segment or recurring versus non-recurring revenue.
2. Revenue growth rate
Absolute revenue tells you scale. Growth rate tells you trajectory. Looking at both prevents a large business from appearing healthy merely because the absolute number is large.
The executive question: Is growth accelerating, stable or slowing?
Choose the comparison carefully. Month-on-month growth can be misleading in seasonal businesses. Year-on-year, rolling periods or like-for-like comparisons may be more meaningful.
3. Gross margin
Revenue growth that destroys margin is not automatically good growth. Gross margin helps executives see whether sales are translating into economically useful business.
The executive question: Is the quality of revenue improving or deteriorating?
When margin moves, the dashboard should make it possible to investigate price, product mix, input costs, discounting or delivery costs rather than simply showing a red indicator.

4. Operating profit or EBITDA
The appropriate profitability measure depends on how the organization manages the business. What matters is that the definition is agreed and consistent.
The executive question: Are operating economics moving in the right direction as the business grows?
Avoid presenting multiple slightly different profit definitions on the same executive screen unless each has a distinct management purpose.
5. Cash position and cash conversion
Profitability and cash are different management questions. A company can report healthy revenue and earnings while creating pressure through receivables, inventory or other working-capital requirements.
The executive question: Is growth translating into cash, and is liquidity moving toward a constraint?
For some businesses, cash balance is enough. Others should track operating cash flow, days sales outstanding, cash conversion cycle or another working-capital indicator.
6. Sales pipeline coverage
Revenue is backward-looking. Pipeline is one way to look forward. Rather than showing total pipeline value alone, compare qualified pipeline with the revenue target for the relevant future period.
The executive question: Do we currently have enough credible opportunity to support the plan?
Pipeline quality matters more than pipeline size. Stage definitions, aging, close-date hygiene and historical conversion should be considered before executives trust the number.
7. Win rate or conversion rate
Pipeline coverage without conversion can create false confidence. A declining win rate can reveal pricing, positioning, lead quality or execution issues before they appear fully in revenue.
The executive question: Are we becoming more or less effective at turning opportunities into customers?
Use a stable denominator and cohort logic where possible. Constantly changing definitions make trend analysis meaningless.

8. Customer retention or churn
For recurring-revenue businesses, retention can be more informative than new sales. For transactional businesses, repeat purchase rate or active-customer retention may be the better equivalent.
The executive question: Are customers continuing to choose us after the initial sale?
A single company-wide churn rate can hide important differences by cohort, product, customer size or geography, so provide drill-down capability rather than overcrowding the executive view.
9. Customer acquisition efficiency
Customer acquisition cost is useful only when its calculation is consistent and related to the economics of the customer acquired. Depending on the business, leaders may prefer CAC, payback period, marketing efficiency ratio or sales-and-marketing cost as a percentage of new revenue.
The executive question: Are we acquiring growth at an economically sustainable cost?
Avoid presenting CAC without explaining which acquisition costs and customers are included.
10. Customer profitability or contribution margin
Revenue by customer can be deceptive. Two customers generating the same revenue can have radically different support, delivery, discount and service costs.
The executive question: Which customers, segments or products create economic value after the costs required to serve them?
This often requires combining CRM, finance and operational data, which is where a well-designed BI architecture becomes important.
11. Operational service level
Every CEO dashboard needs at least one metric that represents the engine of the business. For a manufacturer it might be on-time delivery or yield. For a software platform it could be availability or incident rate. For professional services it might be utilization or delivery performance.
The executive question: Is the operating system of the company delivering what customers were promised?

Do not choose a metric simply because operations already reports it. Choose the operational measure whose deterioration would eventually damage revenue, margin, retention or reputation.
12. A leading indicator specific to your business model
The twelfth metric should often be the most distinctive. It might be active users, order frequency, booked utilization, backlog, occupancy, renewal pipeline, production throughput or another measure that moves before the financial result.
The executive question: What can we see today that tells us something important about the next quarter?
This is where generic dashboard templates usually fail. A good executive dashboard reflects the causal mechanics of the particular business.
How to choose the right CEO dashboard metrics
1. Start with decisions, not data
Ask executives what recurring decisions they make. Pricing? Hiring? Capacity? Marketing allocation? Product investment? Customer intervention? Each important decision should have a small set of measures that informs it.
2. Separate outcomes from drivers
Revenue, profit and cash are outcomes. Pipeline, retention, utilization, order volume and product engagement can be drivers. A dashboard containing only outcomes tells management what happened but gives little indication of what may happen next.
3. Define every KPI before building it
For each metric, document the business definition, calculation, source systems, owner, refresh frequency, dimensions and exclusions. Terms such as active customer, qualified opportunity and gross margin often sound universal while different departments calculate them differently.
4. Use targets and context
A number without context forces the reader to remember what good looks like. Show an appropriate target, prior period, forecast or benchmark. The comparison should reflect the management question rather than visual convenience.
5. Make exceptions visible
Executives do not need to inspect every stable metric with equal intensity. Design should draw attention to meaningful exceptions, but thresholds need business logic. Turning every small variance red trains users to ignore alerts.
6. Design drill-downs without turning the first page into an operating report
A CEO may need to move from revenue variance to region, product or customer. That does not mean all those dimensions belong on the opening screen. A strong BI implementation preserves a concise executive layer while allowing controlled exploration underneath it.

Actiknow’s BI implementation approach includes data integration, modeling, visualization, publishing and refresh mechanisms. Those capabilities are useful when an executive dashboard needs to bring together information that currently lives across finance systems, CRM platforms, databases, APIs and spreadsheets.
What should not be on the CEO dashboard
Avoid vanity metrics that look impressive but do not change a decision. Avoid departmental measures simply because they are easy to extract. Avoid dozens of KPIs with equal visual weight. Avoid unexplained composite scores. Avoid metrics whose owners cannot agree on the definition.
Most importantly, do not confuse dashboard completeness with management usefulness. A CEO dashboard is an attention-allocation system. Every additional metric competes for that attention.
A practical implementation sequence
First, identify the recurring executive decisions and the financial outcomes management cares about. Second, map the leading indicators that influence those outcomes. Third, agree definitions and ownership. Fourth, establish reliable source-to-metric reconciliation. Fifth, prototype the executive view before investing heavily in visual polish. Sixth, run the dashboard alongside existing management reporting until discrepancies are understood. Finally, review the metric set periodically as strategy and business conditions change.
The dashboard should evolve because the business evolves, not because a new visualization became available.
Questions a CEO should be able to ask after looking at the dashboard
A good test is whether the dashboard naturally leads to useful management questions: Why is revenue ahead of plan but margin behind? Which customer segment is driving the change? Is pipeline sufficient for next quarter? Is the conversion rate deteriorating? Are receivables growing faster than sales? Is customer retention changing before revenue reflects it? Which operating constraint could limit growth?
If the dashboard produces these conversations, it is doing its job. If the meeting is spent debating whose spreadsheet is correct, the priority is data definitions and reconciliation rather than additional visuals.
Frequently Asked Questions
How many metrics should a CEO dashboard have?
There is no mandatory number. For many organizations, roughly eight to fifteen top-level measures can provide enough coverage without overwhelming the reader, but complexity and business model matter more than the count. The opening view should remain selective, with supporting detail available through drill-downs.
Should a CEO dashboard show real-time data?
Only when the decision being made requires real-time information. Many strategic and financial decisions work perfectly well with daily, weekly or monthly refreshes. Faster refresh creates additional engineering, monitoring and source-system requirements, so freshness should match the business response time.
What is the difference between a CEO dashboard and an operational dashboard?
A CEO dashboard emphasizes enterprise outcomes, leading indicators and material exceptions. Operational dashboards support day-to-day execution and usually contain more granular measures. The two should share consistent definitions, but they serve different decisions.
Should every KPI have a target?
Not necessarily. Targets are useful where the business has a meaningful plan, threshold or service level. Some diagnostic measures are better interpreted through trends or comparisons. A forced target can create false precision.
How often should CEO dashboard metrics be reviewed?
The data refresh cadence and the KPI review cadence are separate decisions. Data might refresh daily while executives formally review it weekly. The KPI set itself should be reconsidered when strategy, business model, organizational ownership or economic conditions materially change.
Can one CEO dashboard work for every company?
No. Revenue, profitability and cash are widely relevant, but the leading indicators differ substantially. A subscription company may emphasize retention and recurring revenue, while a manufacturer may prioritize throughput, backlog and on-time delivery. The dashboard should represent how that particular business creates value.
Call to action
If your executive team has plenty of reports but still spends management meetings reconciling numbers or searching for the signal, Actiknow can help assess the reporting architecture, KPI definitions and dashboard design. Explore Actiknow’s Business Intelligence services or contact Actiknow to discuss the reporting problem you are trying to solve.