
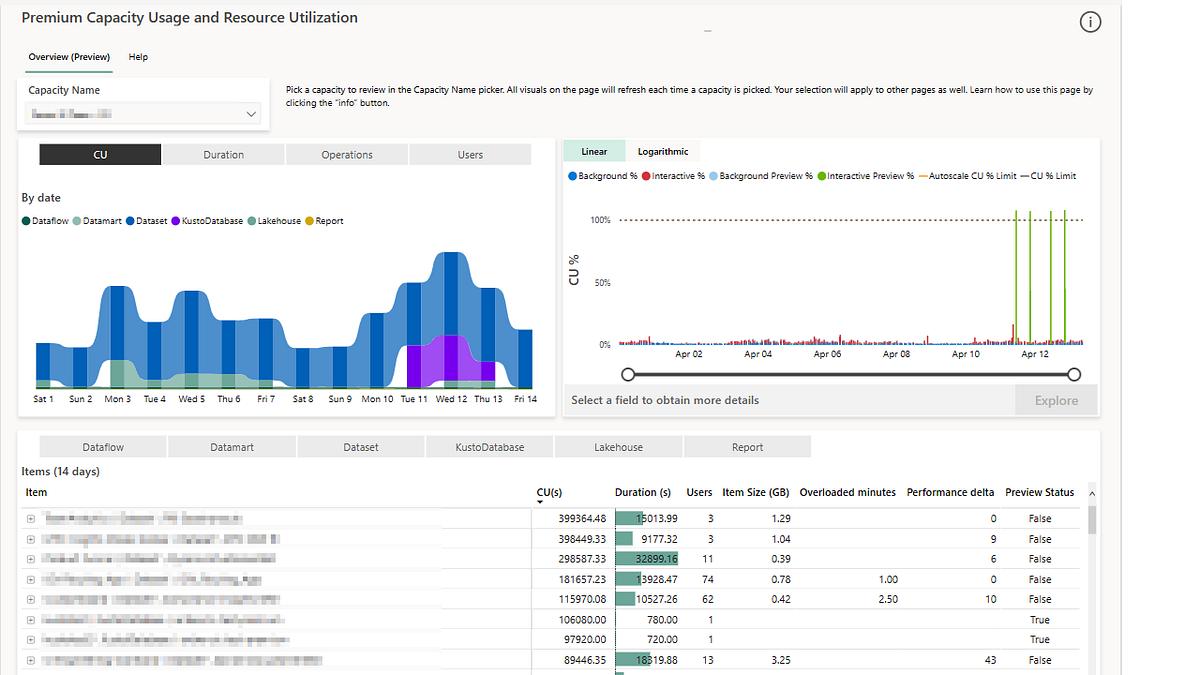
Capacity planning for Power BI and Microsoft Fabric is easy to oversimplify. A company counts users, picks a capacity that appears large enough, and assumes it can resize later if performance becomes a problem.
That approach ignores how analytics platforms actually consume compute.
Two organizations with the same number of users can have very different capacity requirements. One may have hundreds of users who open a few optimized executive dashboards each morning. Another may have a smaller audience running complex interactive queries while semantic models refresh, data pipelines execute, exports are generated and embedded reports serve customers. User count alone does not describe either workload.
The practical goal of Power BI Fabric capacity planning is therefore not to predict one perfect SKU before implementation. It is to understand the workload, establish measurable assumptions, test realistic demand, monitor actual consumption and create a scaling policy before users experience instability.
Actiknow’s business intelligence services cover BI architecture, Power BI implementation, data-source integration, publishing and refresh design. Those are directly relevant to capacity planning because performance depends on the complete analytical path, not only the report canvas.
Start With Workload, Not User Count
Capacity exists to serve work. The first planning exercise should describe that work.
For each important analytics workload, document the audience, usage pattern, semantic model, refresh frequency, data volume, query complexity, concurrency, exports, subscriptions, embedded traffic and any other Fabric workloads sharing the same capacity.
A useful distinction is between baseline demand and peak demand.
Baseline demand is the normal load the environment carries through an ordinary day. Peak demand is what happens when several expensive activities overlap. Month-end reporting, Monday-morning executive reviews, scheduled model refreshes and customer-facing embedded usage can create peaks that are much more important than average utilization.
Capacity should be designed around acceptable performance during meaningful peaks, not merely around a daily average.

The Six Variables That Matter Most
1. Peak concurrency
Monthly active users are useful for adoption reporting, but they are a weak capacity metric. What matters operationally is how many users are actively generating queries at the same time and what those queries cost.
Measure concurrency by business event. Executive meetings, sales reviews, finance close and customer login patterns often create predictable bursts.
2. Semantic model size and design
Model size matters, but design matters just as much. Poor relationships, unnecessary columns, excessive cardinality, inefficient calculations and badly structured measures can make a moderate model expensive.
Capacity planning should not become an excuse to buy compute around an avoidable modeling problem. Before scaling capacity, review whether the semantic model itself is efficient.
3. Refresh workload
Refreshes compete for resources too. Inventory which models refresh, how often they refresh, how long they run, whether refreshes overlap, and whether upstream data is actually ready when refresh begins.
A common design mistake is to schedule many models at the same convenient clock time. Staggering workloads may improve stability without changing capacity.
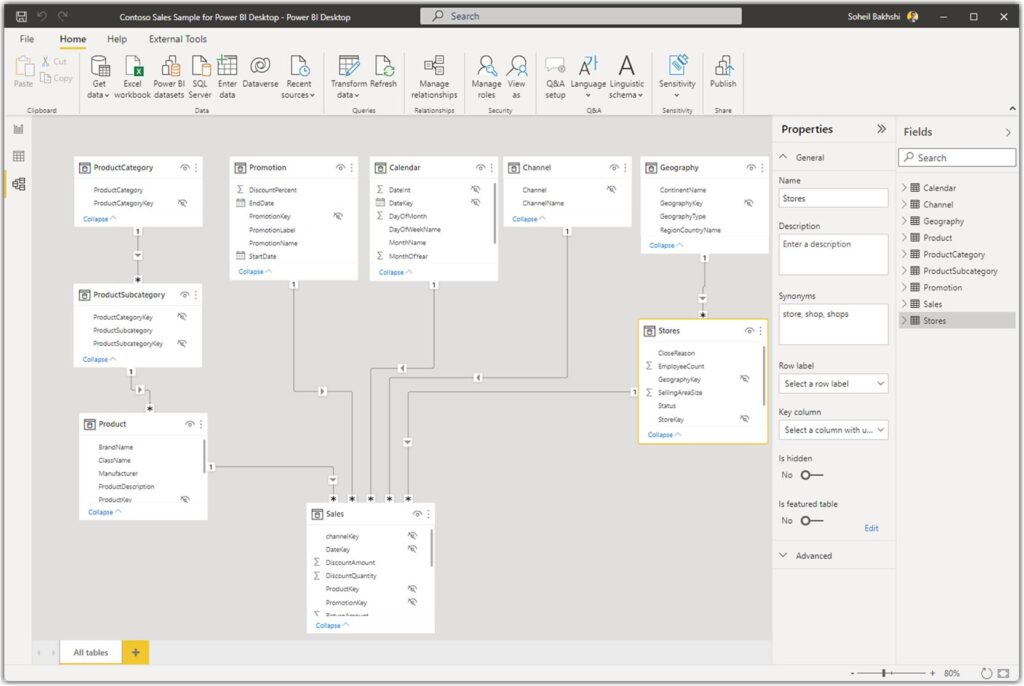
4. Report interaction complexity
A report page containing a few well-designed visuals can behave very differently from a page containing many visuals, complex measures, high-cardinality slicers and expensive cross-filter interactions.
Test representative pages rather than assuming every report interaction has the same cost.
5. Embedded analytics
Embedded analytics changes the demand profile because usage may be driven by customers rather than employees. Growth in customer accounts, tenant activity and product adoption can therefore translate directly into analytics load.
Actiknow’s guide to Power BI Embedded pricing makes the same practical point from a budgeting perspective: baseline capacity, peak capacity, operating schedule, concurrency, model behavior and future scaling should be treated as variables rather than hidden assumptions.
6. Other Fabric workloads
If Power BI shares capacity with data engineering, notebooks, warehouses or other Fabric workloads, planning must consider the combined demand. A BI team cannot size its environment accurately while pretending those workloads do not exist.

Build a Capacity Workload Inventory
Before choosing capacity, create a workload inventory with one row per important workload.
Capture:
- business process supported;
- audience and user type;
- critical usage window;
- expected concurrent users;
- semantic model size;
- data refresh schedule;
- refresh duration;
- major report or query patterns;
- embedded versus internal consumption;
- exports, subscriptions or automation;
- service-level expectation;
- business impact of poor performance.
This exercise often exposes architecture issues before any performance testing begins.
For example, an executive dashboard may be business-critical but lightly used. A customer-facing embedded report may have much higher concurrency. A finance model may refresh only once a day but perform heavy transformations. These should not be treated as equivalent workloads simply because they all appear in Power BI.
Separate Performance Problems From Capacity Problems
When reports slow down, increasing capacity is only one possible response.
Investigate the path systematically.
Is the source query slow? Is the model too large? Is a DAX measure expensive? Are too many visuals querying simultaneously? Is a refresh competing with interactive users? Is an upstream pipeline late? Is embedded traffic spiking? Is another Fabric workload consuming resources?
Buying more capacity can hide inefficient design temporarily. It can also be exactly the right answer when a well-designed workload has genuinely outgrown available compute. The important point is to diagnose before scaling.
A practical sequence is:
- reproduce the slow experience;
- identify whether the bottleneck is source, model, report, refresh or shared compute;
- optimize obvious inefficiencies;
- retest with representative concurrency;
- scale capacity only when measured demand still justifies it.
Test Realistic Peaks Before Production
A capacity test should resemble the operating environment.
Use realistic data volumes and representative semantic models. Run important refreshes. Exercise the reports that matter most. Include the number of simultaneous users expected during peak periods. If analytics is embedded in a product, test the application path rather than only opening the report directly in Power BI.
Do not test only the happy path.
Include complex filters, exports, cold starts, large tenants, high-usage customers, scheduled refresh overlap and other conditions that can materially change resource demand.
Actiknow’s BI implementation guidance emphasizes testing realistic filters, concurrency, dataset sizes, refresh windows and failure scenarios before a pilot is considered complete. Capacity planning should use the same production-readiness mindset.
Design Around Business Criticality
Not every workload deserves the same service level.
Classify workloads into practical tiers.
Tier 1 may include executive reporting, customer-facing analytics, financial reporting and operational dashboards used to run the business. Performance degradation here has visible consequences.
Tier 2 may include departmental reporting that is important but can tolerate occasional delay.
Tier 3 may include exploratory analysis, development workloads and low-priority refreshes.
This classification helps teams decide which workloads should share capacity, which should be isolated, and which can be scheduled away from critical windows.
Isolation can be more valuable than simply increasing total compute. A customer-facing analytics workload should not necessarily compete with a large experimental data-engineering job.
Use Monitoring to Replace Assumptions
The first capacity choice is an estimate. Production monitoring turns it into evidence.
Track utilization over time, but do not stop at one aggregate percentage. Look at when pressure occurs, which workloads are responsible, how long pressure lasts and whether users experience slower response.
Useful operational questions include:
- Which hours consistently create the highest load?
- Which semantic models consume the most resources?
- Do refreshes overlap with interactive peaks?
- Are particular reports disproportionately expensive?
- Does customer growth correlate with embedded demand?
- Are there recurring throttling or delay patterns?
- Is spare capacity available during most of the day but insufficient during one predictable window?
The answer may be optimization, rescheduling, isolation, scaling, or a combination.
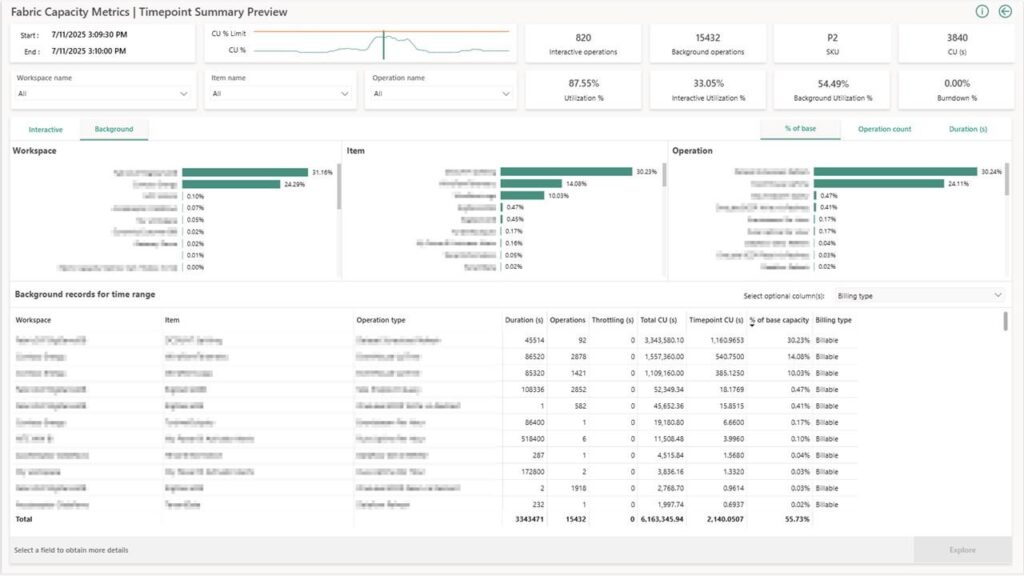
Create a Scaling Policy Before You Need It
Capacity planning should define what happens when demand changes.
Set thresholds and review triggers. For example, a sustained increase in peak interactive demand may trigger load testing. A new embedded customer tier may require capacity reassessment. A large semantic model or new Fabric workload may require isolation testing before deployment.
The policy should also define who owns the decision. Without ownership, teams often wait until users complain and then make emergency changes.
Budget for Growth Without Buying Years of Headroom
There are two expensive extremes.
The first is under-sizing production and forcing users to live through performance problems while the team investigates. The second is buying large amounts of unused capacity because future demand is uncertain.
A better approach is to make growth assumptions explicit.
Model current baseline demand, current peak demand, expected adoption, planned workloads and plausible high-growth scenarios. Then determine what can be changed operationally as demand grows.
For embedded analytics in particular, connect the capacity model to product metrics such as active tenants, peak sessions and feature adoption. This makes infrastructure planning part of product economics rather than a surprise platform bill.

A Practical Executive Decision Framework
Before approving a Power BI or Fabric capacity plan, leadership should be able to answer ten questions:
- What business workloads will run on the capacity?
- What are the expected peak usage windows?
- How many users are active concurrently during those windows?
- Which models and reports are the most computationally demanding?
- Which refreshes and background workloads overlap with interactive demand?
- Is embedded analytics part of the workload?
- What other Fabric services share the capacity?
- What performance level is required for critical workloads?
- What monitoring will show that the capacity is becoming constrained?
- What is the agreed response when those thresholds are reached?
If those questions cannot be answered, the organization is not really capacity planning. It is selecting a SKU and hoping.
Common Capacity Planning Mistakes
Sizing from licensed users. Licensing population and simultaneous workload are different concepts.
Testing with sample data. Small development models can hide production behavior.
Ignoring refresh. Interactive reports and background processing can collide.
Treating every report equally. A lightly used strategic dashboard and a high-volume embedded experience have different demand profiles.
Scaling before optimizing. More compute should not substitute for fixing obviously inefficient models and reports.
Optimizing forever instead of scaling. Engineering time also costs money. Once a workload is sound, additional capacity may be the economically sensible answer.
Ignoring growth. Capacity should be reviewed when usage patterns, customer counts, models or Fabric workloads change.
Frequently Asked Questions
How should I estimate Power BI Fabric capacity?
Start with workload characteristics rather than user count. Measure expected concurrency, semantic model size, report complexity, refresh demand, embedded usage, peak periods and other Fabric workloads. Test a representative environment and refine the estimate using monitoring.
Is user count enough to size Power BI capacity?
No. User count does not describe how many people are active simultaneously or how expensive their interactions are. Concurrency and workload behavior are more useful planning inputs.
Should refreshes run during business hours?
Sometimes, but the choice should be deliberate. If refreshes consume meaningful resources and freshness requirements allow it, staggering them away from interactive peaks can reduce contention.
Does a slow Power BI report mean capacity is too small?
Not necessarily. Slow source queries, inefficient semantic models, expensive calculations, excessive visuals and refresh contention can all cause poor performance. Diagnose the bottleneck before scaling.
How should SaaS companies plan Power BI Embedded capacity?
Model baseline and peak customer usage, concurrency, tenant distribution, model complexity, refresh activity and expected customer growth. Test through the actual embedded application path.
Can we start small and scale later?
Often yes, provided the architecture is tested, monitoring is in place and the organization has a clear scaling trigger. Starting small should not mean launching an untested workload.
That depends on workload size and risk. Where development activity can materially affect production performance, stronger workload isolation is worth considering.
What should executives review after launch?
Review peak utilization, user-facing performance, expensive workloads, refresh overlap, growth trends, incidents and the effectiveness of optimization or scaling actions.
Conclusion
Power BI Fabric capacity planning works best as an evidence cycle: describe the workload, estimate demand, test realistic peaks, monitor production behavior, optimize inefficient designs and scale when measured demand requires it.
The key is to stop treating capacity as a one-time licensing decision.
Capacity is part of the operating architecture. It sits alongside semantic-model design, refresh orchestration, embedded usage, data engineering and governance. Organizations that measure those dependencies can make deliberate cost-performance tradeoffs instead of reacting to slow dashboards after launch.
If you are planning or reassessing a Power BI environment, Actiknow can help evaluate the BI architecture, data integration, semantic models, refresh design and workload assumptions before capacity decisions become production problems. Discuss your BI requirements with Actiknow.