

Customers often buy products together. The difficult question is whether that pattern should change a retailer’s merchandising, promotions, search recommendations, or inventory decisions. A pair that appears frequently may simply contain two popular products. A statistically strong association may have little margin left after discounts and fulfillment. And an attractive historical pattern may disappear when a promotion ends.
BigQuery market basket analysis helps teams move beyond a list of top-selling products toward an evidence-based view of which items occur in the same transaction. The useful output is not a ranking of pairs alone. It is a shortlist of commercially plausible actions, each with enough transaction evidence, clear economics, and a way to measure incremental results.
This guide explains the data model, the four association measures executives should understand, a reproducible GoogleSQL example, the conversational analytics capability added in September 2026, and a practical path from analysis to controlled retail experiments.
What changed in BigQuery in September 2026?
On September 3, 2026, Google Cloud announced generally available support for market basket analysis questions in BigQuery conversational analytics. According to the BigQuery release notes, this is support for asking questions about an analytic task, not the launch of a separate market-basket database engine or a promise that every generated recommendation is commercially valid.
Google’s conversational analytics documentation describes built-in SQL templates for association-rule analysis and identifies four output measures: leverage, support, confidence, and lift. Its published example asks, “What are the best product bundling opportunities based on data from 2025?” using the public Iowa liquor sales dataset. The capability can make initial exploration easier, but analysts still need to inspect the generated logic, source data, filters, and business assumptions.
The product details and availability are documented in Google’s BigQuery release notes and conversational analytics overview. Those sources are preferable to treating a natural-language answer as an independent validation of the underlying data.
What market basket analysis actually answers
Market basket analysis identifies items that co-occur within a defined basket, usually an order or point-of-sale transaction. It can reveal candidate bundles, complementary products for a product-detail page, cross-merchandising opportunities, or categories whose demand should be planned together.
It does not, on its own, prove that one item caused the other to be purchased. A weekend barbecue promotion might increase sales of both charcoal and beverages. A store layout might place two items near one another. Loyalty customers may buy larger baskets of everything. Association is a useful hypothesis generator, not a substitute for incremental measurement.
Start with one commercial question: “Which combinations could increase contribution margin per eligible order without hurting conversion or stock availability?” That is more actionable than “Find the strongest associations in our data.”

Four measures that turn co-purchases into interpretable evidence
1. Support: how common is the combination?
Support(A,B) is the share of all eligible baskets containing both products A and B. It protects against overreacting to a dramatic-looking relationship based on very few orders. Low-support combinations may still matter for premium niches, but they need a different testing and inventory strategy from high-volume combinations.
2. Confidence: how often does B appear when A appears?
Confidence(A→B) is the number of baskets containing both A and B divided by the number containing A. It is directional: confidence(A→B) is generally different from confidence(B→A). For a recommendation shown on product A’s page, the A→B direction is the one to examine.
3. Lift: is the relationship stronger than B’s baseline popularity?
Lift(A→B) is confidence(A→B) divided by the overall share of baskets containing B. A lift above 1 indicates that B occurs more often among A baskets than in the full eligible population; a lift near 1 suggests little additional association beyond B’s popularity. Lift is not an incremental sales multiplier and should not be described as one.
4. Leverage: how much extra co-occurrence exists?
Leverage(A,B) is support(A,B) minus support(A) × support(B). It measures the absolute difference between observed joint occurrence and the occurrence expected under independence. A high lift on a rare pair can coexist with tiny leverage, which may make the pair difficult to commercialize at scale.
Worked example: a hypothetical 1,000-basket sample
Suppose a filtered dataset contains 1,000 baskets. Product A appears in 200, product B in 250, and both appear in 80. Support is 80/1,000 = 8%; confidence(A→B) is 80/200 = 40%; baseline prevalence of B is 25%; lift is 40%/25% = 1.6; and leverage is 8% − (20% × 25%) = 3 percentage points.
This means B appears in 40% of A baskets, compared with 25% of all baskets. It does not mean that recommending B will produce a 60% sales lift. The numbers are illustrative, not an Actiknow client result or a benchmark.
Define the basket before writing a query
A market basket project can produce plausible but wrong answers when the unit of analysis is unclear. For an online retailer, an order may be a useful basket. For a grocery chain, it might be a register receipt. For a subscription service, a customer-day or completed purchase session might be more appropriate. Do not silently combine these grains.
Create a curated order-line table with at least order_id, order_date, product_id or SKU, quantity, order_status, store or channel, and monetary fields needed for commercial evaluation. Use a stable transaction identifier, not a customer identifier, as the basket key. Two separate orders by the same customer are not automatically one basket.
Decide in writing how to handle canceled orders, returns, exchanges, split shipments, free samples, bundles already sold as one SKU, and quantities greater than one. A refunded line should not quietly count as a successful purchase. If returns are recorded later, define a maturity window or refresh historical baskets when the return arrives.
For multichannel retailers, decide whether to compare online and in-store baskets separately. Store size, assortment, and customer intent can make pooled patterns misleading. Apply the same time zone and transaction-completion logic that finance uses for sales reporting.
The underlying data integration and modeling work is often more consequential than the analysis method. Actiknow’s business intelligence services describe integrating databases and APIs, modeling data, and building reporting solutions. A retailer should make the order-line definition auditable before publishing affinity results.
A practical BigQuery SQL starting point
The following illustrative GoogleSQL uses a fictional table named project.retail.order_items. Replace it with a curated production table and approved business filters. Each order/SKU combination is deduplicated so buying three units of one SKU does not triple its co-occurrence count. The query generates directional two-item rules and calculates support, confidence, lift, and leverage.

WITH baskets AS (
SELECT DISTINCT order_id, sku
FROM `project.retail.order_items`
WHERE order_date BETWEEN DATE ‘2026-07-01’ AND DATE ‘2026-09-30’
AND order_status = ‘COMPLETED’
AND quantity > 0
AND sku IS NOT NULL
),
basket_count AS (
SELECT COUNT(DISTINCT order_id) AS total_baskets FROM baskets
),
item_counts AS (
SELECT sku, COUNT(*) AS item_baskets
FROM baskets GROUP BY sku
),
pair_counts AS (
SELECT a.sku AS antecedent, b.sku AS consequent,
COUNT(*) AS pair_baskets
FROM baskets a JOIN baskets b USING (order_id)
WHERE a.sku <> b.sku
GROUP BY 1, 2
)
SELECT p.antecedent, p.consequent, p.pair_baskets,
SAFE_DIVIDE(p.pair_baskets, t.total_baskets) AS support,
SAFE_DIVIDE(p.pair_baskets, a.item_baskets) AS confidence,
SAFE_DIVIDE(
SAFE_DIVIDE(p.pair_baskets, a.item_baskets),
SAFE_DIVIDE(b.item_baskets, t.total_baskets)
) AS lift,
SAFE_DIVIDE(p.pair_baskets, t.total_baskets)
– SAFE_DIVIDE(a.item_baskets, t.total_baskets)
* SAFE_DIVIDE(b.item_baskets, t.total_baskets) AS leverage
FROM pair_counts p
JOIN item_counts a ON p.antecedent = a.sku
JOIN item_counts b ON p.consequent = b.sku
CROSS JOIN basket_count t
WHERE p.pair_baskets >= 30 — illustrative threshold only
ORDER BY lift DESC, pair_baskets DESC
LIMIT 100;
Read the output as candidate rules, not a ranked promotion plan. The threshold of 30 co-purchases is only a demonstration; an appropriate minimum depends on traffic, expected margin, seasonality, and the precision needed for a decision. A rule with a high lift but only a few transactions is usually a weaker starting point than one with stable evidence across weeks and stores.
The self-join generates up to k × (k−1) directional pairs for a basket with k distinct products. Very large baskets can therefore make a naive pair-generation query expensive. Filter to a meaningful assortment or category, pre-aggregate one row per order/SKU, partition by order date, consider a minimum item-frequency screen, and review query execution cost before running across years of detailed transactions.
For larger implementations, materialize a curated basket table and an incrementally refreshed pair-count table, with a defined lookback for late transactions and returns. Store analysis window, channel, product hierarchy version, and rule-calculation version alongside each result so a dashboard can explain why a relationship changed.
Using conversational analytics without outsourcing judgment
A useful initial prompt is: “For completed online orders in the last 13 weeks, find product pairs with at least 100 co-purchases. Show support, confidence, lift, and leverage; exclude gift cards and existing bundles; and compare the results with the preceding 13 weeks.” This is an example prompt, not a guarantee that the agent will infer every business filter correctly.
Review the generated SQL or query explanation and confirm the basket key, filters, denominator, date range, and direction of the rule. Ask whether the agent has joined an order header to multiple payment or shipment rows, accidentally multiplying purchases. If an answer depends on specialized exclusions, define them in a governed view or verified query rather than hoping the model will reconstruct them each time.
Google’s conversational analytics guidance recommends cleaned source tables, joined views where necessary, verified queries, glossary definitions, and clear instructions. It also cautions that generated output can be factually incorrect. Treat natural language as an interface to governed analysis, not as a replacement for a reconciled retail data model.
Prioritize opportunities with a commercial decision framework
First filter: is the pattern stable and sufficiently large?
Compare association measures across at least two independent time windows. Check channel, store format, geography, customer cohort, and promotional periods. A relationship that exists only during a short-lived discount campaign may be real but unsuitable for an always-on recommendation.
Second filter: does the pairing make sense operationally?
Ask merchandising teams whether the products are complementary, substitutes, or simply both common. Check whether B is available wherever A is sold. A pair can be statistically attractive but impossible to execute because of stockouts, fragile items, regulatory restrictions, incompatible sizes, or conflicting supplier agreements.

Third filter: will it improve contribution margin?
Estimate the margin on incremental units, not just combined revenue. Deduct discounts, fulfillment, payment fees, expected returns, and merchandising costs. If a shopper would have bought B anyway, offering a bundle discount may transfer margin to the customer without creating a new purchase.
Consider a purely hypothetical order in which A contributes $12 and B contributes $6 before any promotion. If a bundle gives away $5 in discount, the combined contribution becomes $13 rather than $18 before any incremental costs. Whether that is worthwhile depends on how many genuinely additional B units the promotion produces. Association metrics cannot answer that question.
Fourth filter: can the intervention be tested?
Choose an intervention that can be exposed to an eligible audience and withheld from a comparable control group: a product-page recommendation, a cart suggestion, a shelf adjacency, a curated bundle, or a targeted email. Define the eligible population and success metric before launch. If an idea cannot be measured, it belongs in a research backlog rather than the first production experiment.
Five decisions market basket analysis can support
Product-page recommendations: show complementary items when A is viewed or added to cart. Use confidence(A→B) and availability as inputs, then test whether the recommendation increases incremental contribution margin rather than clicks alone.
Bundle design: identify plausible pairs with enough support to make a packaged offer operationally meaningful. Include packaging, returns, and discount economics in the approval process.
Store merchandising: compare pairs by store format or region before adjusting shelf placement. Physical adjacency may be constrained by category management, planograms, and replenishment requirements.
Inventory coordination: flag products whose demand often coincides, but do not replace demand forecasts with pair statistics. A co-purchase pattern is one signal for joint availability planning, not proof of synchronized future demand.
Promotion review: test whether apparent affinities persist outside discount periods. A pair that only rises during a joint promotion should not be presented as an organic customer preference.

Measure incremental impact, not just association
For digital recommendations, randomize eligible sessions or customers into treatment and control groups and keep assignment stable where practical. For stores, use matched locations or a staggered rollout when individual randomization is impossible, and acknowledge the greater risk of confounding.
Make incremental contribution margin per eligible basket the primary commercial outcome when that is the actual objective. Secondary metrics may include attach rate, conversion, average order value, units per transaction, return rate, inventory availability, and customer complaints. An attach-rate increase can coexist with lower margin if discounts are too deep.
Predefine the minimum meaningful effect and sample-size approach. Avoid selecting winners after repeatedly inspecting dozens of pairs and stopping as soon as one looks promising. Reserve a holdout period or fresh store set for confirmation, especially when many candidate associations have been mined from the same historical data.
Track interventions separately from discovered rules. A recommendation can fail because of placement, stockouts, price, or poor timing even when the historical association is genuine. Record exposure, eligibility, click or view, add-to-cart, purchase, discount, and return events so teams can distinguish a weak rule from a weak execution.
Build an executive dashboard that leads to action
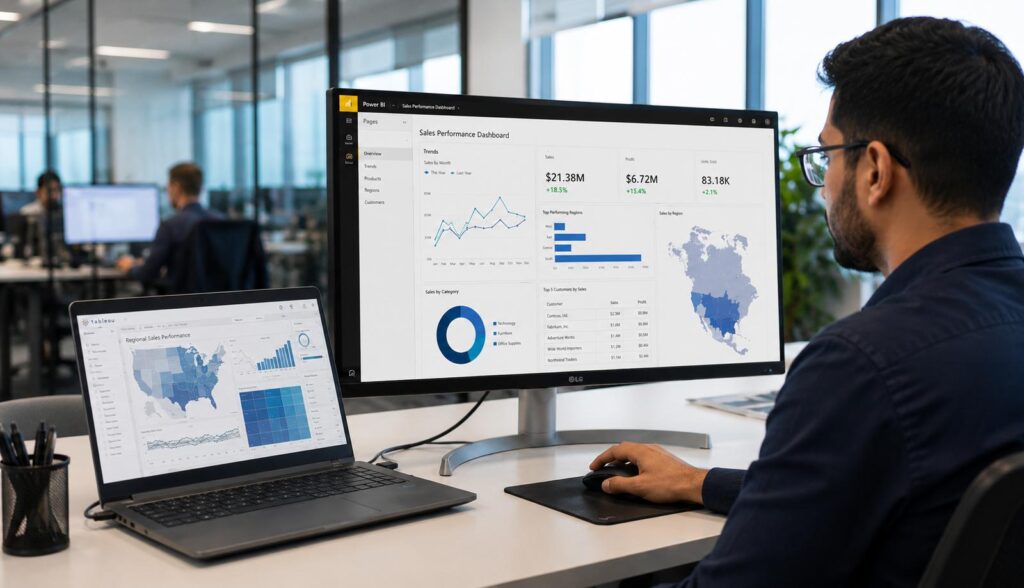
A useful affinity dashboard should not display a giant matrix of products and stop there. Give each opportunity an owner, a proposed intervention, an evidence window, a stability score, and an experiment status. Executives should see the commercial pipeline: candidates identified, candidates qualified, tests running, decisions made, and incremental margin measured.
For each approved rule, show pair volume, support, directional confidence, lift, leverage, margin estimates, stock availability, and performance by segment. Include a drill-down to the exact basket definition and source period. This is the kind of operational reporting layer that Actiknow’s business intelligence dashboard services describe, including integration, metric definition, and custom dashboards.
Before any dashboard goes live, reconcile order counts, line quantities, refunds, and net sales to the transaction system. A duplicate join can create impressive but false affinities. Actiknow’s guide to data warehouse reconciliation outlines a broader validation approach for source counts, derived metrics, deletes, and late-arriving records.
Governance, privacy, and BigQuery cost controls
Most association analysis does not require names, email addresses, or raw customer identifiers. Prefer transaction-level keys and approved segments. Limit access to sensitive dimensions, apply appropriate row- and column-level controls, and document retention for any customer-level experiment data. Do not assume a retail analytics use case grants permission to repurpose personal information.
BigQuery query costs depend on the processing model and work performed. Start with a bounded date range and category, estimate query bytes where applicable, and monitor jobs before scheduling large pairwise joins. Use partition pruning, clustering where justified, curated intermediate tables, and incremental recomputation when data volume warrants it.
For conversational analysis, govern the sources an agent can access, review query history and generated logic, and monitor spend. Separate exploratory analyst permissions from production publishing permissions. A good workflow can reproduce a recommendation from a saved query and a documented data snapshot even if the conversational interface changes.
A four-week implementation plan
Week 1: establish trusted transaction data
Agree on the business objective and basket grain. Build or validate a completed-order line view, define returns and cancellation treatment, and reconcile transaction and revenue totals with the source. Record channel, time zone, and product taxonomy rules.
Week 2: build and review the affinity baseline
Run SQL-based pair analysis for a bounded historical period. Inspect support, confidence, lift, and leverage; compare top pairs across weeks and channels; and have merchandising review obvious false positives, bundles, and substitutes.
Week 3: shortlist interventions and prepare experiments
Score candidates on evidence, stability, margin, availability, execution cost, and testability. Select a small number of interventions, define control groups, instrument exposure and conversion events, and agree on stop or rollback criteria.
Week 4: launch controlled tests and publish an operating view
Launch only where data and operational checks pass. Monitor guardrails daily, avoid premature conclusions, and publish a concise decision dashboard. Assign ownership for reviewing results and refreshing rules when assortment, pricing, or seasonality changes.
What success should look like
The output of a successful pilot is not “we discovered 10,000 rules.” It is a reconciled dataset, reproducible SQL, a prioritized shortlist with commercial rationale, a functioning measurement design, and a documented decision about which interventions to scale, revise, or reject.
A good program can also conclude that the strongest pairs are already well served by existing merchandising. That is a useful result: it prevents unnecessary discounts and focuses resources on genuinely unserved opportunities.
Frequently asked questions
Is BigQuery market basket analysis a separate paid product?
No separate product is required for the association-rule concept. BigQuery can calculate co-purchases with SQL, and conversational analytics added generally available support for market basket questions in September 2026. Normal BigQuery compute and applicable conversational analytics charges still matter.
Do I need machine learning to find product affinities?
No. Basic two-item association rules can be calculated with SQL. More advanced recommendation systems may use collaborative filtering, ranking models, or contextual signals, but those are separate decisions.
What is a good lift score?
There is no universal threshold. Lift should be interpreted alongside support, leverage, stability, commercial margin, and the proposed action. A high lift on a handful of orders can be less useful than a modest, repeatable lift at meaningful scale.
Why can confidence be misleading?
Because a popular product B may appear in many baskets regardless of A. Confidence can look high even when A provides little additional information. Lift compares confidence with B’s baseline prevalence.
Should returns and canceled orders be excluded?
Usually, an analysis of completed purchasing behavior should not treat canceled lines as purchases. Returns require a documented rule: exclude returned items, use a maturity window, or publish both gross and net purchase views depending on the decision.
Can I use the same rules for online and physical stores?
You can compare them, but do not assume identical behavior. Assortment, basket size, store layout, and promotions differ. Segment the analysis and validate whether the rule transfers.
Does a strong association prove a bundle will increase revenue?
No. It shows historical co-occurrence. A bundle’s incremental revenue and margin must be tested against a credible control or evaluated with an appropriate causal design.
How often should association rules be refreshed?
Refresh frequency depends on transaction volume, assortment turnover, and the speed of commercial decisions. Weekly may suit many pilots; volatile promotions may require faster monitoring. Recompute and validate when data corrections or taxonomy changes occur.
Can conversational analytics replace SQL review?
No. Natural-language analysis can accelerate exploration, but teams still need to verify query definitions, source permissions, metric calculations, and commercial interpretations before acting.
What should a first pilot deliver?
A documented basket model, reconciled order data, reproducible association metrics, a shortlist of commercially feasible pairs, a controlled test plan, and an owner for the decision dashboard.
From product affinity to a measurable retail decision
Market basket analysis is valuable when it is connected to the decisions a retailer can actually make. Support identifies scale, confidence identifies direction, lift adjusts for popularity, and leverage shows absolute association. None of these measures replaces contribution-margin analysis or a controlled test.
If your retail data is spread across ecommerce, POS, ERP, and merchandising systems, Actiknow can discuss the data integration, modeling, and BI reporting requirements needed to turn transaction data into a decision-ready workflow. Contact Actiknow to review the scope of a practical market basket analytics pilot.
References
Google Cloud: BigQuery release notes, September 3, 2026; Conversational analytics overview (analytic task support, safeguards, and best practices).