
A practical measurement blueprint for product leaders, CTOs and teams building business-critical mobile applications
Executive summary
An app can accumulate downloads, generate thousands of sessions and still fail to deliver value. A customer may install it without completing registration. A field employee may open it every day but abandon the inspection form at the photo-upload step. A subscriber may return frequently without finishing a lesson or renewing. These are not minor reporting gaps. They are differences between activity and outcomes.
A useful mobile app analytics architecture connects five questions: Who can reach the product? Who reaches a first meaningful outcome? Who completes the workflows that matter? Who returns and obtains lasting value? And what technical or operational failures prevent success? The design must also connect client-side behavior to authoritative backend results, while respecting privacy choices.
The right starting point is not a dashboard or an SDK. It is a short measurement contract agreed by product, engineering, analytics, operations and the business owner. This article lays out that contract, the data pipeline behind it, and the decisions leaders should expect the resulting metrics to support.
1. Start with the business outcome, not the event list
Before instrumenting a screen, write one sentence describing the value a successful user receives. For a commerce app, that might be a completed and accepted order. For a field-service app, it could be a submitted and approved job report. For an education app, it may be completion of a learning activity that contributes to an explicit learning plan. Each is more specific than ‘engagement.’

Separate the value delivered to the user from the value delivered to the organization. A completed appointment booking is a user outcome; fulfilled appointments and contribution margin are business outcomes. They may correlate, but they are not interchangeable. The measurement architecture should allow the team to see where the relationship breaks down.
Choose one primary outcome for the core journey and a small number of guardrails. For example, improving checkout completion should not come at the expense of payment failures, refunds or customer complaints. For an internal workforce app, faster submissions should not come at the expense of missing mandatory fields or rejected records.
Define a metric tree that can guide decisions
A practical tree has four levels: acquisition and eligibility; activation; repeated successful use; and verified business results. Reliability, accessibility and data quality act as guardrails across all levels. Each metric needs an owner, numerator, denominator, time window, eligibility rule and source of truth. If these definitions are not documented, teams will argue about numbers instead of improving the product.
Example: ‘Activation within seven days’ could mean eligible first-time users who complete a defined first-value action within seven days of first eligible use, divided by all eligible first-time users in that cohort. The denominator should state how test users, reinstallations, consent limitations and identity merges are handled. This is an illustrative definition, not a universal benchmark.
2. Measure the entire mobile lifecycle
Acquisition: distinguish installation from usable reach
Track store impressions, store listing conversion, installs or first opens, app version, supported device mix and attribution quality where available. Treat store downloads and analytics first opens as different measurements: store platforms and in-app SDKs observe different events, populations and privacy conditions. Campaign reporting should make that difference explicit rather than force artificial reconciliation.
Ask which channels bring eligible users, not merely cheap installs. A channel that delivers users who cannot pass eligibility checks or never complete onboarding may have low apparent acquisition cost and poor economic value. Where attribution is incomplete, report an unattributed segment rather than assigning every conversion to a guessed campaign.
Activation: identify the first meaningful success
Instrument the steps between first open and the first completed outcome: permission prompts, sign-up, verification, profile completion, data import, tutorial completion and first successful action. Capture failure reasons and time between steps. A funnel should reveal whether users stop because they are confused, blocked by a service, asked for unnecessary permissions or simply not ready.
Do not define activation as ‘viewed home screen’ unless seeing that screen is itself the product’s value. An app that requires a successful appointment booking should measure booking confirmed, not just booking started. In B2B apps, the first meaningful action may happen only after an administrator provisions access; distinguish provisioning delay from end-user friction.
For every critical workflow, measure started, submitted, accepted, failed, cancelled and reversed where those states exist. A button tap is not a completed transaction. Network retries can generate duplicate taps; offline queues can defer submission; a backend can reject an apparently successful client action. The final status should come from the system that owns the transaction.
A service-order journey might contain job_opened, evidence_attached, report_submitted, report_accepted and report_rejected. Use a stable workflow ID to join the app event to the backend record. Avoid putting names, phone numbers, free-text notes or other personal data in analytics payloads. If a workflow can be reopened, model each attempt and the final state explicitly.
Retention: measure return to value, not only return to the app
Day-1, day-7 and day-30 retention can be useful, but a generic return event may be misleading. A monthly expense-approval app is not expected to be used daily; a navigation app may be used frequently without account creation. Define meaningful retention around the product’s natural usage cadence and the action that constitutes value.
Use cohort-based measures rather than dividing this week’s active users by last week’s active users. A cohort groups users by a clear starting point, such as first eligible use or first successful workflow, and asks what share returns to complete a meaningful action in a specified later window. Include a clear distinction between user retention, account retention and subscription retention.
Revenue and operational outcomes: close the loop
For paid apps, connect trial starts, verified subscriptions, renewals, refunds and cancellations to the payment or subscription system of record. For marketplaces, distinguish booking requests from fulfilled transactions. For enterprise apps, track tasks accepted, rework, time-to-resolution and downstream service quality. A value event should be tied to an operational record whenever possible.
Avoid double counting from client and server events. One transaction may create a client confirmation, a payment webhook and an order record. Decide which is authoritative for revenue and fulfillment, then use the others for diagnostics and reconciliation.
3. Design an event taxonomy that survives product changes
An event taxonomy is a controlled vocabulary of what happened, when, to which workflow, and with which permitted context. It should be understandable without knowing a particular screen layout. Prefer business verbs such as booking_confirmed or inspection_submitted over implementation-specific names such as blue_button_clicked.
A minimal event specification should record: event name; business definition; trigger and emitting system; required parameters and types; permitted values; identifier policy; consent requirements; owner; and test cases. Add a version or documented change history so renamed screens, new onboarding flows and app releases do not silently redefine a KPI.
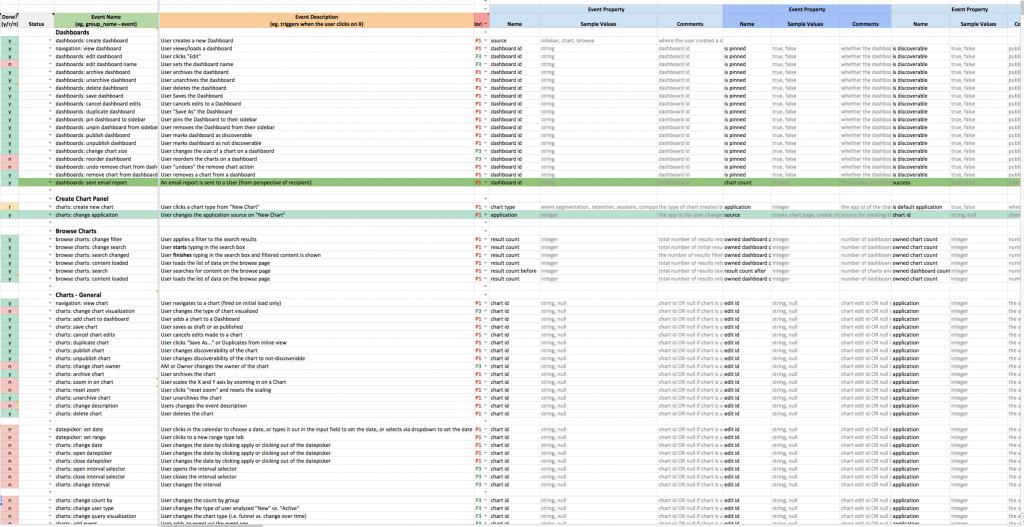
Illustrative event contract
Event: inspection_submitted. Meaning: the user has requested submission of a completed inspection. Source: mobile client. Required parameters: workflow_id (opaque identifier), workflow_type (approved enum), app_version, offline_queued (boolean) and event_schema_version. Separate backend event: inspection_accepted, emitted only after validation and persistence. Optional diagnostic: submission_latency_ms. Do not transmit inspection comments or photo contents as analytics parameters.
The contract deliberately separates ‘submitted’ from ‘accepted.’ If the user is offline, a submitted event may be queued and arrive later; the backend acceptance timestamp should determine the operational completion metric. If an event is retried, a deduplication key or workflow state transition prevents multiple accepted outcomes from being counted.
Use established event names and parameter conventions where appropriate. The official Firebase guidance on logging app events documents automatic and custom event collection, recommended event types and validation options. Custom names should be introduced only when the standard vocabulary cannot describe the actual business action.
Identity and sessions require explicit rules
An anonymous installation identifier is not a customer identity. A person can reinstall, switch devices, use a shared tablet or log into multiple accounts. Decide when a stable internal user ID may be attached, how anonymous activity is associated after login, and how to avoid merging activity across users on shared devices. Never use an email address as an analytics event identifier.
Session boundaries can be useful for interface diagnostics but should not define business completion. A workflow may begin in one session, continue offline and finish the next day. Store the workflow identifier and server-side outcome independently of session IDs. Document how user deletion requests and identity resets propagate to analytical stores.
4. Use a layered architecture, not a single analytics dashboard
For many teams, a workable design has five components: mobile instrumentation; event collection; operational system events; an analytical storage and transformation layer; and reporting with metric definitions. The exact tools can vary. What matters is that behavioral signals and authoritative business outcomes can be joined, tested and explained.

Layer A: client-side behavioral instrumentation
The mobile app emits consent-permitted events for navigation, feature use, form validation, onboarding steps and client errors. Instrument the same business semantics across iOS and Android even if their screen layouts differ. Include platform and app version so release-specific problems are visible. Do not assume automatic screen-view collection captures every meaningful action.
Layer B: server-side business events
Backend services emit events when an order is confirmed, an inspection is accepted, a payment is settled or a workflow is rejected. Use the transactional database as the authority for final state. Where reliable event delivery matters, consider an outbox or comparable transactional publishing pattern rather than an unguarded best-effort API call.
Layer C: ingestion, storage and modeling
A common pattern sends app analytics to a collection platform, exports permitted event data into a warehouse, and joins it to backend records in curated models. Google’s documentation describes Firebase data export to BigQuery, including daily synchronization and export constraints. Design reporting schedules around actual delivery behavior rather than assuming every event appears instantly.
Keep raw event data separate from modeled fact tables. A raw_events table supports debugging; a fact_workflow_attempt table can represent one attempt and its terminal state; a fact_user_activation table can store the first verified value event; and a daily cohort mart can provide consistent retention measures. Apply data access controls and retention rules appropriate to each layer.
Layer D: semantic definitions and decision dashboards
Expose a small, governed set of measures: activation rate, critical workflow completion rate, median and tail completion time, meaningful retention, verified transaction value, crash-free usage and reconciliation gaps. The dashboard should support drilldowns by app version, platform, cohort and workflow, with thresholds based on product context rather than arbitrary industry averages.
For organizations already investing in custom mobile products, Actiknow’s custom solutions practice covers mobile applications, integrations and data collection tools. The measurement design should be considered alongside those application and integration decisions, not bolted on after launch.
5. Make reliability a product metric
Product analytics often explains what users did; observability helps explain why they could not finish. Track crash-free users or sessions, application-not-responding incidents where relevant, API failures, network timeouts, offline queue depth, sync age, rejected submissions and the time to recover. Segment by build and device class to distinguish a product regression from a cohort change.

Firebase Crashlytics provides crash and non-fatal error diagnostics and describes crash-free metrics. However, crash-free does not mean task-successful: a frozen upload, repeated authentication prompt or silently failed synchronization may never crash the app. Pair technical diagnostics with a business-level completion measure.
Define a critical journey service level indicator: successful completed workflows divided by eligible workflow attempts over a stated window. Exclude user-initiated cancellations only if the definition is approved and consistently applied. Review the rate together with error categories and latency. A technically healthy app with falling successful outcomes still needs investigation.
6. Build privacy and consent into the data model
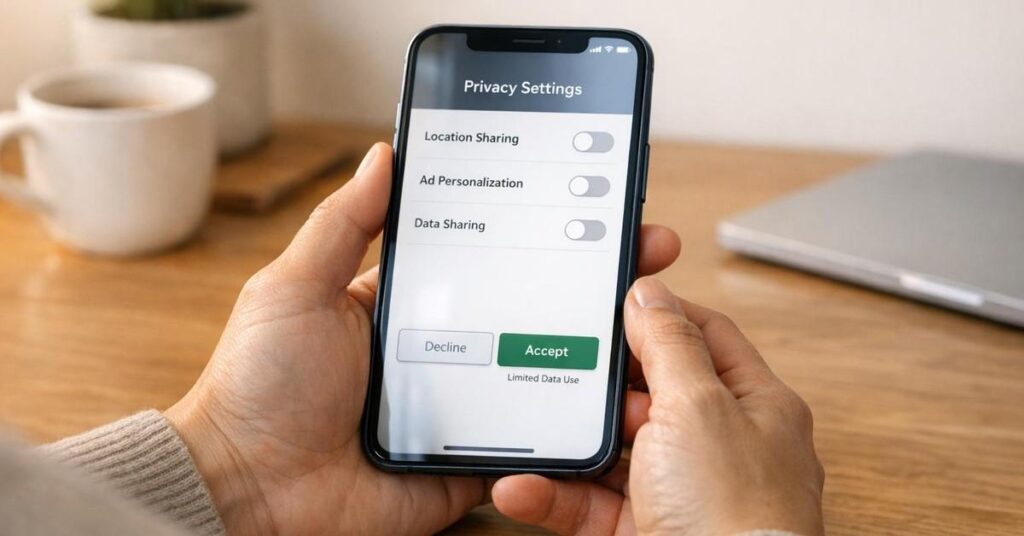
Collect only data needed for a specific decision. Avoid free-form text, precise location, contact details, health information, payment credentials or sensitive identifiers in general-purpose analytics events. If location is essential to the workflow, evaluate whether a coarse region or server-side derived category can answer the reporting question.
Consent and platform policies affect what is observable. Apple’s App Store Connect analytics documentation notes that some app-usage metrics include only users who opted to share usage information, and that certain views require privacy thresholds. Treat platform-provided analytics and in-app SDK data as different populations with different collection rules.
Document consent states, region-specific requirements, retention schedules, access roles and deletion procedures. An analytics SDK may support configuration controls, but a product team still needs a lawful collection basis and a clear privacy notice. Do not silently replace missing consented events with modeled ‘complete’ user histories. Show coverage and unknowns in reporting.
7. Define the executive scorecard before choosing charts
A useful executive view can fit on one page if each metric leads to a decision. Acquisition quality: eligible first-time users and activation by channel. Product value: verified first-value completion and time to value. Adoption: meaningful retention by cohort. Operations: accepted workflows and rework. Reliability: crash-free usage, sync failures and completion success. Economics: verified revenue or operational cost per completed outcome, when the underlying financial data supports the calculation.
Every metric should have a trend, a clearly defined denominator and a named accountable owner. The scorecard should allow investigation by platform, release, geography at an appropriate privacy level, customer segment and acquisition source. Avoid vanity charts that cannot prompt an action. For example, a rise in sessions without a rise in completed jobs should lead to a workflow investigation, not a celebratory adoption headline.
Illustrative diagnostic example
Suppose a field-service app reports more weekly active users after a new release, but accepted inspection reports decline. A funnel shows that submissions remain steady while server rejections increase for a specific app version. The likely next step is to inspect validation or payload changes, not spend more on acquisition. This is a hypothetical example illustrating a diagnostic method, not an Actiknow client result.
8. Put data quality checks in the release process
Analytics instrumentation is production code. Include it in acceptance criteria, code review, automated tests and release notes. For each critical event, verify that it fires once at the intended transition, carries permitted and correctly typed parameters, does not expose personal data, and behaves sensibly during retries, offline use and background execution.
Test both platforms and representative app versions. Validate that a canceled workflow does not appear as completed, that a resumed offline submission is not counted twice, and that a server rejection is reflected in the analytical model. Check that dashboards reconcile with authoritative backend counts for a sample period. Define an acceptable variance and an investigation owner rather than assuming perfect equality across systems with different timing.
Monitor event-volume anomalies, missing required parameters, unknown enum values, delayed exports and broken joins. Maintain a data dictionary and deprecation process. When the app introduces a new step or changes the definition of activation, publish the effective date and either preserve comparability or visibly break the trend.
9. A practical 30-day implementation plan
Week 1: agree on outcomes and definitions
Map the three most important user journeys. For each, identify the first-value event, the authoritative completion state, meaningful retention cadence and business guardrails. Inventory current SDKs, backend records, privacy requirements and dashboards. Appoint a product metric owner and a technical instrumentation owner.
Week 2: write the tracking plan and data contract
Specify a deliberately small set of critical events and their parameters. Document identity handling, offline behavior, deduplication, consent gates and app-version compatibility. Define the transformation logic for activation, workflow success and retention. Review the event plan with engineering, analytics, security and business operations before implementation.
Week 3: instrument, validate and reconcile
Implement or correct instrumentation in a test build. Create test cases for success, cancellation, retry, failure, offline submission and multi-device use. Build the first modeled tables and reconcile selected transaction counts to backend records. Fix measurement defects before treating dashboard trends as evidence.
Week 4: launch the operating review
Release the scorecard to a small decision-making group. Assign thresholds and escalation paths for critical journey failures. Review one product hypothesis and one reliability issue using the same metrics. Record what action was taken and whether the next cohort improved. Expand instrumentation only when a new decision requires it.
10. Common architecture mistakes to avoid
Tracking every tap without a question to answer creates noise and governance burden. Treating client confirmation as financial truth inflates business outcomes. Mixing anonymous installs with authenticated users distorts retention. Ignoring offline workflows hides delays and duplicates. Comparing platform store data to SDK events as if they were identical creates false discrepancies. Shipping new screens without updating the tracking plan breaks historical comparability. Reporting a single ‘engagement rate’ across fundamentally different workflows conceals where value is created.
A related mistake is assuming the analytics vendor defines the strategy. Tools collect and present data; product owners must define what success means. A sensible implementation may use Firebase, another mobile product analytics platform, custom event pipelines or a combination. The architecture should follow data ownership, compliance, decision latency and integration needs.
Frequently asked questions
1. What is mobile app analytics architecture?
It is the design of event collection, identifiers, business outcome data, storage, transformations, metric definitions and reporting used to understand how a mobile product delivers value. It includes governance and validation, not only SDK installation.
2. Which metrics matter most beyond downloads?
Start with first-value activation, critical workflow completion, meaningful retention, reliability and verified business outcomes. Add acquisition and monetization measures only where they support decisions for the product.
3. Is Firebase Analytics enough for a mobile app?
It can be a strong collection and reporting component, but it does not automatically know which backend transaction was accepted, fulfilled or reversed. Business-critical apps often need backend events, modeled data and reconciliation alongside client analytics.
No. Capture critical journey steps and a limited set of diagnostic interactions. Excessive events increase maintenance and make it harder to distinguish useful signals from noise.
5. How should we measure activation?
Define a specific first meaningful outcome, an eligible new-user cohort and a time window. Use the same definition consistently across platforms and releases, with explicit exclusions and identity rules.
6. What is the difference between retention and engagement?
Engagement describes activity or depth of use. Retention asks whether a defined cohort returns to meaningful value in a later period. An app can have long sessions without delivering value, and a utility app can deliver value in short sessions.
7. How do offline mobile apps change analytics design?
Events can be delayed, reordered or retried. Preserve workflow identifiers, event and server timestamps, queue state and idempotent completion logic. Use authoritative backend acceptance for completed transactions.
8. Can iOS and Android metrics be compared directly?
They can be compared when event definitions, eligibility and identity logic are aligned, but store analytics, device coverage, privacy settings and SDK collection differences must be disclosed.
9. How do we avoid collecting sensitive information?
Use approved opaque IDs, allowlisted parameters, consent controls, access restrictions and retention rules. Prohibit free-text and sensitive fields in general-purpose analytics events and test payloads before release.
10. When should analytics be designed in a mobile development project?
During discovery, before detailed screen implementation. Agreeing on critical outcomes early makes event instrumentation, backend status design and acceptance testing materially easier than retrofitting them after launch.
Conclusion: make the app measurable as a business system
Downloads indicate interest. Sessions indicate activity. Neither proves that a person achieved the outcome the app exists to deliver. A credible measurement architecture links first value, completed workflows, repeat value, reliability and verified business results through consistent event contracts and trustworthy backend records.
If your team is planning a new app or repairing fragmented measurement in an existing one, Actiknow’s cross-platform mobile application development services describe its approach to application delivery. To discuss how product workflows, integrations and reporting should fit together, contact Actiknow with your key user journeys and current measurement gaps.
Selected technical references
Google Analytics for Firebase: official overview of app measurement and event collection.
Firebase Analytics BigQuery export: documentation for analytical export behavior and operational constraints.
Firebase Crashlytics: official guidance on crash diagnostics and stability metrics.
Apple App Store Connect Analytics: platform analytics coverage and privacy limitations.