
Bad data is rarely a data-team problem. It is a business operating cost.
A sales leader discovers that the pipeline report contains duplicate accounts. Finance spends two days reconciling revenue because customer identifiers differ between the CRM and billing system. Operations exports data to Excel every Monday because the dashboard cannot reproduce the numbers used in the weekly review. Executives receive three versions of the same KPI and spend the meeting debating which one is correct.
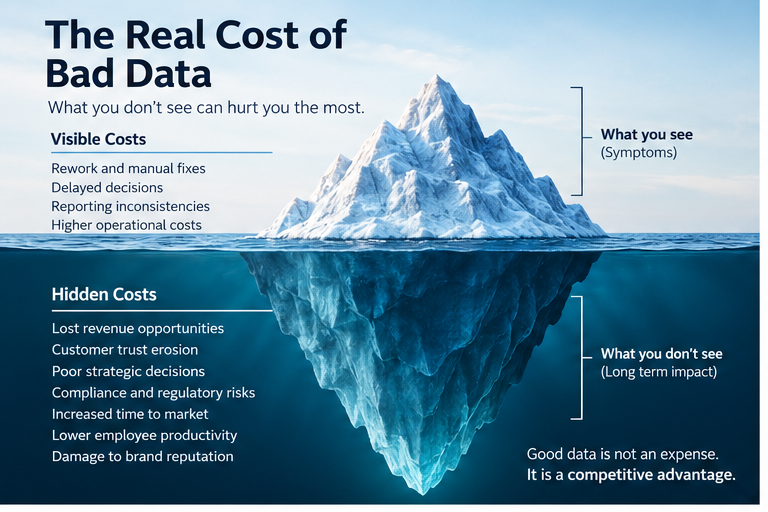
None of these failures may appear as a line item called “bad data.” The cost is distributed across salaries, delayed actions, missed revenue, unnecessary inventory, customer friction, compliance exposure, and technology that people stop trusting.
This is why the right question for a CEO is not, “How much should we spend on analytics?” It is, “Which business decisions are being impaired by unreliable data, what is that impairment costing us, and which problems are worth fixing first?”
What does poor data quality actually mean?
Poor data quality means that information is not sufficiently reliable for the business purpose for which it is being used. The important phrase is “for the business purpose.” Data does not need to be perfect to be useful, and perfection is usually an expensive target.
A missing phone number may have little consequence in a profitability report. The same missing number may matter greatly in a customer outreach workflow. A product category that is updated one day late may be acceptable for monthly planning but unacceptable for an automated fulfillment decision.
Executives should therefore assess data quality against specific decisions and processes, rather than treating quality as a generic score.
Common dimensions include accuracy, completeness, consistency, timeliness, uniqueness, validity, and integrity between related records. These dimensions are useful only when connected to a consequence. A duplicate customer record matters because it can distort pipeline, attribution, credit limits, service history, or customer profitability.
Why the cost of bad data is difficult to see
Poor data quality is often hidden because the organization compensates for it manually. Employees reconcile spreadsheets, correct fields, ask colleagues for confirmation, rebuild reports, and maintain private mapping tables. The work becomes normal.
This creates a dangerous illusion: the system appears to function because people are absorbing its failures.
A CEO reviewing technology spend may see the license cost of a CRM, ERP, warehouse, or BI platform. The organization may not separately track the hundreds of hours spent correcting and reconciling the information flowing between those systems.
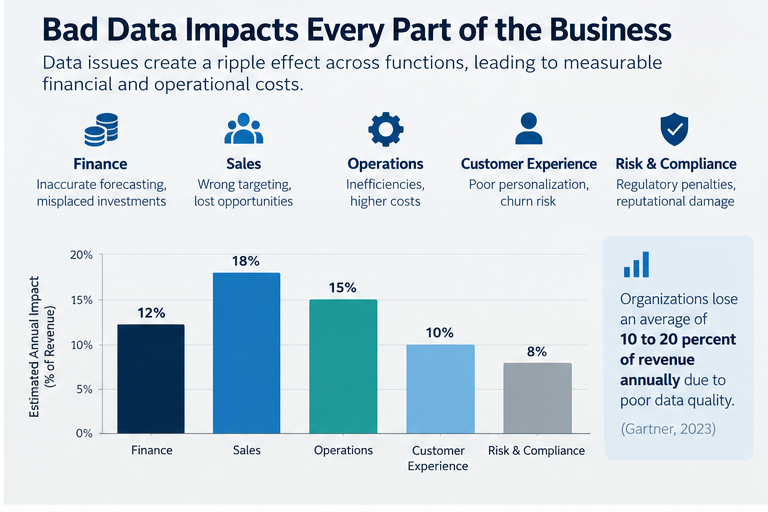
The first step is therefore not to estimate an industry-wide percentage of revenue supposedly lost to bad data. Such benchmarks can be attention-grabbing but are rarely useful for an investment decision. Measure the costs inside your own workflows.
1. Measure manual data rework
Start with recurring work that exists because information cannot be trusted as delivered.
Examples include cleaning exports, removing duplicates, mapping customer names between systems, fixing spreadsheet formulas, reconciling dashboards against finance reports, manually categorizing transactions, correcting missing fields, and rebuilding reports after source changes.
For each important reporting or operational process, record how many people participate, how many hours they spend, how often the work occurs, and an appropriate fully loaded hourly cost.
Suppose five employees collectively spend 18 hours each week reconciling sales, billing, and finance data. At an illustrative fully loaded cost of $40 per hour over 50 working weeks, the annual capacity involved is:
18 hours × $40 × 50 = $36,000
That does not automatically mean the company will save $36,000 in cash by improving the data. If nobody leaves and payroll remains unchanged, the more defensible statement is that the organization can release up to $36,000 worth of annual employee capacity for other work. Whether that capacity becomes a financial benefit depends on how it is used.
This distinction prevents inflated ROI cases.
2. Measure decision delay
Some of the largest costs do not come from fixing records. They come from waiting for reliable information.
Consider a pricing team that needs four days to assemble margin data before approving a price change. A sales executive who cannot identify stalled opportunities until the monthly review. An operations manager who sees inventory exceptions only after a weekly spreadsheet is prepared.
Measure the elapsed time between when a decision could reasonably be made and when trustworthy information becomes available. Then identify what business action is delayed.
Do not immediately assign a monetary value to every hour of delay. First establish the operational measure: days to approve pricing, hours to identify an exception, days to produce month-end reporting, or time required to answer a management question.
Where a financial consequence can be traced, estimate it separately and document the assumptions.
3. Measure revenue leakage and missed opportunities
Poor data can affect revenue when the organization cannot identify, prioritize, bill, renew, or serve customers correctly.
Potential examples include unbilled services, incorrect pricing, duplicate or incomplete leads, missed renewals, inaccurate territory assignments, failed cross-sell targeting, and opportunities ignored because account history is fragmented.
The safest way to quantify leakage is to identify actual exceptions rather than applying a generic percentage to total revenue.
For example, review a sample of invoices against contracted services. Examine expired customers that should have entered a renewal workflow. Compare duplicate CRM accounts with open opportunities. Measure how many records have a defect, how often that defect causes a financial exception, and the average value of the exception.
Keep observed leakage separate from potential leakage. If a defect could cause lost revenue but you have not demonstrated that it did, label it as exposure rather than realized loss.
4. Measure reporting and reconciliation cost
Executives often underestimate how much reporting infrastructure is duplicated because users do not trust the official version.
Look for parallel spreadsheets, manually maintained executive packs, duplicate dashboards, departmental databases, and reports that reproduce the same KPI using different rules.
The cost has several components: preparation time, review time, reconciliation time, maintenance of duplicate logic, and the opportunity cost of meetings spent debating definitions.
Track the number of recurring reports, the hours required to produce them, the number of manual adjustments, and the number of material discrepancies found during reconciliation.
A particularly useful metric is “time to trusted number”: how long does it take from a question being asked until the organization has a number that the relevant business owners accept?
5. Measure customer friction
Data problems become customer problems when customers have to repeat information, receive inconsistent communication, encounter incorrect invoices, or are treated as separate people or companies across systems.
Useful measures include billing disputes caused by incorrect data, support cases involving account or entitlement errors, duplicate communications, failed personalization, incorrect service levels, and time spent by customer-facing teams resolving identity issues.
Customer impact should not automatically be converted into churn revenue unless the relationship can be demonstrated. It is often better to track operational evidence first: number of incidents, resolution time, repeat contacts, and affected customers.
6. Measure control, compliance, and security exposure
Some data defects have a low frequency but a high consequence. Incorrect access classifications, missing consent information, incomplete audit trails, stale employee permissions, or poorly governed personal information may create compliance and security exposure.
This category should be evaluated with the relevant legal, security, finance, and compliance owners. Avoid inventing an expected financial penalty. Record the control weakness, affected data, frequency, detection method, remediation effort, and plausible business consequence.
The goal is not to manufacture ROI from risk. It is to ensure that risk reduction is considered alongside productivity and revenue outcomes when investments are prioritized.
7. Measure technology waste caused by mistrust
A company can spend heavily on analytics while employees continue to use spreadsheets because they do not trust the data. In that case, part of the technology investment is economically stranded.
Measure active usage of important reports, but do not confuse logins with value. Interview decision owners and ask which source they actually use in meetings. Identify dashboards that are routinely exported and corrected before use. Track transformations or calculations recreated independently across teams.
If several systems calculate the same KPI differently, the issue may not be the visualization tool at all. The organization may need governed definitions and reusable analytical models.
A practical cost-of-poor-data-quality model
Executives can organize the business case into five buckets:
- Realized cash cost. Spending that actually occurs because of the problem, such as external correction work, credits, duplicate vendor charges, or measurable billing errors.
- Internal capacity cost. Employee time spent cleaning, reconciling, rebuilding, and manually moving information.
- Decision cost. Delays or poor decisions caused by unavailable, inconsistent, or misleading information.
- Revenue and customer impact. Observed leakage, missed renewals, incorrect billing, customer incidents, and other demonstrated commercial effects.
- Risk exposure. Control, security, privacy, or compliance weaknesses whose potential consequence should be evaluated separately from realized savings.
Do not simply add every estimate together. Costs can overlap. The employee time used to resolve a billing error, for example, should not be counted once under rework and again under customer impact unless the measures represent distinct consequences.
How to establish a credible baseline
Choose three to five high-value business processes rather than attempting an enterprise-wide data audit immediately. Good candidates are processes that cross systems, require recurring manual reconciliation, influence meaningful decisions, or generate frequent complaints about numbers.
For each process, capture a four-to-eight-week baseline where practical. Record manual hours, elapsed decision time, exceptions, discrepancies, corrections, and affected transactions. Identify the source systems and the fields or business rules responsible for the problems.
Document assumptions explicitly. If an hourly cost is estimated, state the rate. If only a sample of transactions was reviewed, state the sample. If a financial effect is potential rather than observed, label it accordingly.
This baseline becomes far more valuable than a generic claim that poor data costs companies a particular percentage of revenue.
Do not fix every data problem
Once problems are visible, organizations often create a large cleansing program. That can consume substantial time without changing business outcomes.
Prioritize defects using four questions:
- How consequential is the decision or process affected?
- How frequently does the defect occur?
- Can the root cause be fixed sustainably?
- What will the correction cost to implement and maintain?
A defect affecting 0.1% of low-value records may not deserve immediate engineering work. A customer identity problem that affects 5% of invoices may deserve urgent attention even if the underlying fix is technically difficult.
The correct target is not perfect data. It is economically appropriate reliability.
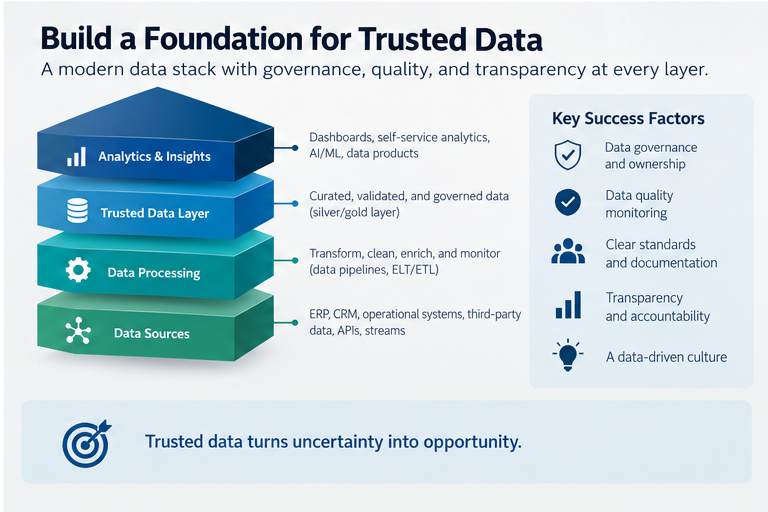
Fix the source, transformation, or consumption layer?
Not every problem should be solved in the same place.
If sales representatives are selecting inconsistent opportunity stages, improve the source process, validation, and training. If two systems legitimately use different customer identifiers, an analytical mapping layer may be appropriate. If an executive report uses the wrong revenue definition, correct the metric logic and governance. If a source API occasionally arrives late, monitoring and a visible freshness indicator may be more appropriate than redesigning the source application.
Prefer root-cause correction when the operational process itself is broken. Use controlled transformations where integration genuinely requires normalization. Avoid accumulating undocumented patches in dashboards because they are quick to implement. Dashboard-level fixes are difficult to reuse, test, and gover
What to measure before approving a new analytics platform
Before investing in a new warehouse, BI platform, data integration tool, or AI analytics capability, an executive team should be able to answer:
- Which decisions are currently constrained by data quality?
- What is the current manual effort required to compensate?
- Which discrepancies occur repeatedly?
- Which financial effects have actually been observed?
- Which risks are exposures rather than realized losses?
- Which root causes are in source processes versus analytical infrastructure?
- What improvement would justify the proposed investment?
- Who owns the business definitions after implementation?
- How will the organization measure whether the problem improved?
If these questions cannot be answered, buying more technology may add another layer without resolving the underlying issue.
How analytics investment should change the baseline
A good investment case connects each proposed capability to a measurable failure mode.
Automated ingestion may reduce manual data movement. Tested transformations may reduce reconciliation differences. Master-data or identity logic may reduce duplicate customers. A governed semantic layer may reduce competing KPI definitions. Monitoring may shorten the time required to detect broken pipelines. Better access controls may reduce inappropriate exposure. A dashboard may shorten decision time if it replaces a manual report and is integrated into the management process.
Define the expected improvement before implementation. For example: reduce weekly reconciliation from 18 hours to six; reduce duplicate active customer records below an agreed threshold; reconcile monthly revenue to the finance system within a documented tolerance; cut executive-report preparation from three days to one; or reduce data-related billing disputes.
These targets can be tested after launch.
How to calculate ROI without overstating it
Start with annual implementation and operating costs: engineering, software licenses, cloud infrastructure, support, maintenance, governance, and training.
Then classify benefits carefully. Cash savings are benefits that reduce actual expenditure. Released capacity is time made available for other work. Revenue benefits should be tied to observed improvements and should account for other factors that may have contributed. Risk reduction should be described using an agreed risk methodology rather than casually converted into revenue.
Suppose a project costs $80,000 in year one. It removes $15,000 of external correction cost, releases $35,000 of internal capacity, and addresses a billing defect associated with $25,000 of observed annual leakage. A simplistic model might call this $75,000 of benefit. A stronger model would ask whether the released capacity will actually be redeployed, whether all $25,000 of leakage is recoverable, and whether implementation creates new recurring costs.
Use a range when uncertainty is material. A conservative case is more useful to an executive than a precise-looking number built on weak assumptions.
Common mistakes when measuring the cost of bad data
- Using a generic industry statistic as the business case. External benchmarks may indicate that the problem matters, but they do not establish your organization’s loss.
- Counting employee time as immediate cash savings. Automation can release capacity without reducing payroll.
- Double-counting benefits. The same incident can appear in several categories unless the model separates consequences carefully.
- Blaming the BI tool for source-process problems. A dashboard cannot repair inconsistent data entry or missing operational controls by itself.
- Trying to cleanse everything before delivering value. Prioritize the data required for consequential decisions.
- Ignoring ownership. A technically correct metric can become unreliable again if nobody owns its definition or source process.
- Measuring quality without measuring use. A 99.9% completeness score is meaningless if the missing 0.1% contains the records needed for an important decision.
Frequently asked questions
What is the cost of poor data quality?
The cost of poor data quality is the measurable business impact created when data is not reliable enough for its intended use. It can include manual correction and reconciliation, delayed decisions, billing errors, missed opportunities, customer-service incidents, duplicated reporting, technology waste, and risk exposure. The amount should be measured from the organization’s own processes rather than assumed from a generic benchmark.
How can a company calculate the cost of bad data?
Begin with several important workflows. Measure manual rework hours, reporting and reconciliation effort, decision delays, actual financial exceptions, customer incidents, and relevant control weaknesses. Apply transparent assumptions to convert only defensible items into financial values, and keep released employee capacity separate from realized cash savings.
What are the most important data-quality metrics?
Accuracy, completeness, consistency, timeliness, uniqueness, validity, and referential integrity are common measures. The most important metric depends on the use case. Executives should connect each measure to a decision or process rather than pursuing an abstract enterprise-wide quality score.
Should we clean our data before implementing BI?
Clean and govern the data required for the first priority use cases, but do not wait for every organizational dataset to become perfect. Identify defects that materially affect the intended decisions, fix root causes where practical, document limitations, and expand quality work as additional use cases are introduced.
Can a data warehouse fix poor data quality?
A data warehouse can provide a controlled place to integrate, transform, test, and retain analytical data, but it cannot automatically correct broken business processes or ambiguous definitions. It may make quality problems easier to detect and manage. Business owners still need to define metrics and improve source processes where appropriate.
How do you measure data-quality ROI?
Compare the post-implementation results with a pre-implementation baseline. Measure changes in correction effort, reconciliation time, decision turnaround, financial exceptions, customer incidents, and other targeted outcomes. Compare defensible benefits with implementation and ongoing costs, distinguishing cash savings, released capacity, revenue effects, and risk reduction.
Is perfect data quality a realistic goal?
Usually not, and it is rarely economically justified. The goal is data that is sufficiently reliable, timely, complete, and governed for the decisions and processes it supports. Quality investment should be proportional to the consequence of failure.
Does AI make data quality more important?
Yes. Natural-language analytics and AI can make data easier to query, but they do not make incorrect or inconsistently defined data trustworthy. AI can also make unreliable information easier to distribute at scale. Organizations adopting AI analytics still need clear definitions, permissions, lineage, testing, and human accountability for consequential decision
A CEO’s 30-day starting point
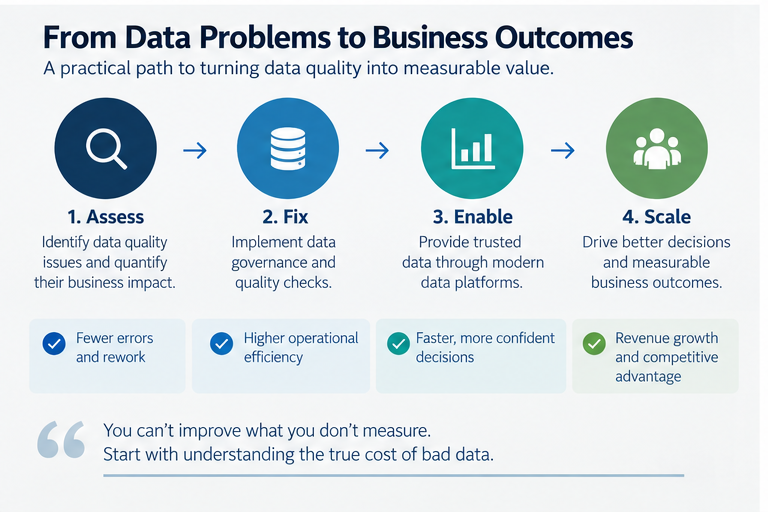
- Week one: Select three consequential processes where leaders regularly question the numbers. Identify the decision owner and the systems involved.
- Week two: Measure manual preparation and reconciliation effort, recurring defects, decision delays, and known financial or customer exceptions.
- Week three: Trace the highest-impact defects to their root causes. Separate source-process problems, integration problems, metric-definition problems, and reporting problems.
- Week four: Prioritize fixes by business consequence and cost. Establish measurable targets and only then decide which technology or engineering investment is required.
Conclusion: Make the invisible cost visible
Poor data quality becomes expensive long before a company labels it a data-quality initiative. The cost appears in reconciliations, delayed meetings, duplicated spreadsheets, incorrect invoices, missed actions, customer frustration, and decisions made with incomplete evidence.
Executives do not need an enterprise-wide quality score before acting. They need a credible baseline for the business processes that matter most. Measure the manual work. Measure the delay. Verify actual financial exceptions. Document risk separately. Identify the root cause. Then invest where the expected improvement exceeds the cost and can be measured after implementation.
That approach turns data quality from a technical complaint into an accountable business decision.
About Actiknow
Actiknow Consulting helps organizations integrate fragmented business systems, engineer reliable analytical data, and build business intelligence solutions across technologies such as Snowflake, BigQuery, Power BI, Tableau, and Looker Studio. If your teams spend significant time reconciling reports or debating which number is correct, a focused assessment of the underlying data flows, definitions, and decision processes can identify where analytics investment will create the most practical value. Learn more at actiknow.com.
Editorial note: Financial examples in this article are illustrative and are not industry benchmarks. Any externally published version should use only verified Actiknow project examples and approved company claims.