
Choosing between Power BI and Tableau is not really a visualization decision
Both platforms can build sophisticated dashboards, connect to enterprise data, support governed analytics, and serve thousands of users. That is why feature-by-feature comparisons often fail to help executives make a decision. The question is not which product can produce the better chart. The question is which platform fits your organization’s technology environment, governance model, user base, operating skills, and economics.
A company deeply invested in Microsoft may reach a different conclusion from a company with a mature Tableau estate. A centralized BI team may value different capabilities from an organization trying to enable hundreds of business analysts. An enterprise with complex embedded analytics requirements may evaluate the platforms differently from a finance team replacing recurring Excel reports.
The right choice therefore begins with your operating model, not a product demonstration.
Power BI vs Tableau: the short answer
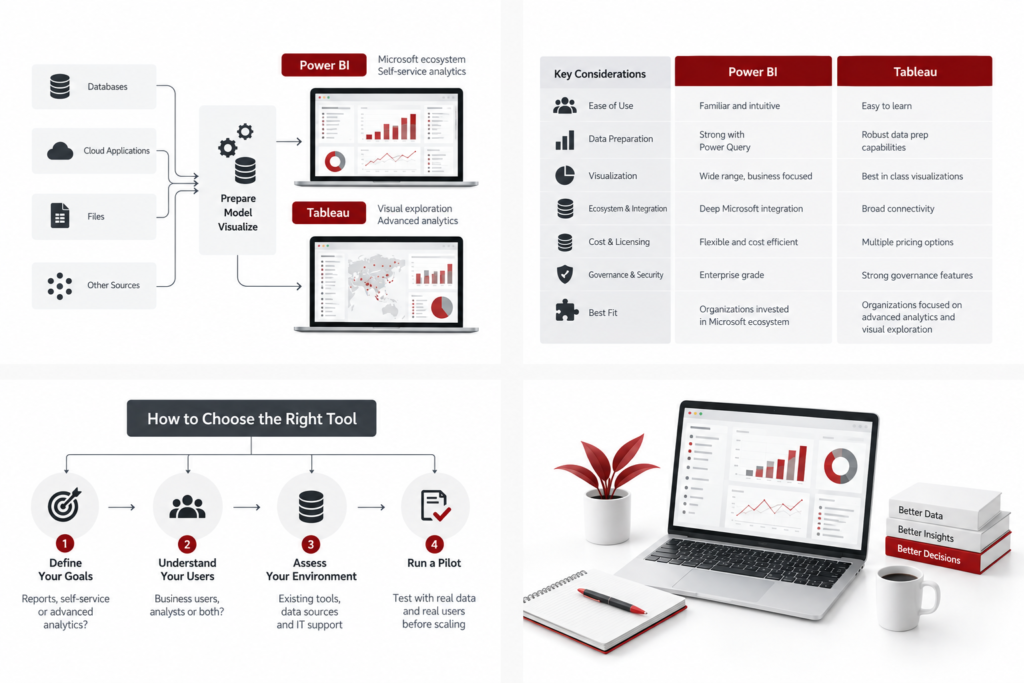
Power BI is often a natural fit for organizations that already use the Microsoft ecosystem extensively and want close alignment with Microsoft 365, Azure, Fabric, and related identity and data services. Tableau remains a strong choice for organizations that prioritize flexible visual exploration, have an established Tableau user community, or operate in environments where its existing data and analytics workflows are already deeply embedded.
Neither conclusion should be automatic. Licensing structure, deployment architecture, data volumes, semantic modeling, governance, analyst skills, existing assets, and migration cost can change the economics substantially.
The most defensible selection process evaluates both platforms against the same real business use cases using your own data and security requirements.
1. Start with the decisions and users
Before comparing software, identify who will use the analytics and what they need to accomplish.
An executive consuming a weekly performance scorecard has very different requirements from an analyst investigating customer behavior. A regional sales manager may need a governed mobile dashboard with row-level security. A finance analyst may need reusable calculations and detailed drill-down. A data team may need centrally managed semantic models that hundreds of reports can reuse.
Segment users into practical groups such as executive consumers, operational managers, business analysts, advanced analysts, report developers, and data platform administrators. Estimate how many users will create content versus consume it.
Then identify five to ten representative use cases. Examples might include executive financial reporting, sales pipeline analysis, customer profitability, operational exceptions, marketing performance, and self-service departmental analysis.
This prevents a common procurement mistake: selecting a platform because a demonstration looks impressive while discovering later that the everyday workflows are awkward or expensive.
2. Evaluate your existing technology ecosystem
Technology fit can materially affect implementation effort and ongoing administration.
Organizations with substantial Microsoft investments should evaluate how Power BI fits their existing identity, productivity, cloud, data, and collaboration environment. Existing Microsoft skills may reduce the number of new concepts administrators and developers need to learn. Integration choices can also influence how users discover and consume reports.
Tableau should be evaluated in the context of the organization’s existing Tableau assets, Salesforce ecosystem, analyst community, data platforms, and deployment practices. Replacing a mature Tableau environment simply because another platform appears cheaper on a license comparison can destroy working dashboards, institutional knowledge, and established processes.
Do not treat ecosystem alignment as vendor loyalty. Convert it into measurable questions: How many integrations become simpler? Which skills already exist internally? What infrastructure can be reused? How much custom engineering is avoided? What dependencies does the choice introduce?
3. Compare semantic modeling, not just dashboards
A BI platform becomes more valuable when important business logic is defined once and reused consistently.
Consider a metric such as gross margin. If every dashboard author independently recreates revenue exclusions, cost allocations, currency rules, and date logic, the organization will eventually have several versions of gross margin. Attractive visualization cannot solve that problem.
During evaluation, test how your team will manage reusable measures, relationships, hierarchies, calculations, and certified data sources. Determine where business logic should live. Some logic may belong in the warehouse transformation layer, some in a governed semantic layer, and some legitimately belongs in a specific report.
Ask whether a change to an important definition can be implemented centrally, tested, documented, and propagated without manually editing dozens of reports.
The best platform for your organization is partly the one your team can govern successfully.
4. Test analytical exploration with real users
Executives often consume predefined information, while analysts need to explore it. These are different workloads.
Give representative analysts an actual business question rather than a prepared dashboard. Ask them to identify a trend, segment the data, test a hypothesis, drill into exceptions, and communicate the finding. Observe how naturally they work in each platform.
Do not judge solely by the speed of an expert vendor demonstrator. Your internal users are the people who must operate the platform after implementation.
Also distinguish self-service from unrestricted report creation. Genuine self-service analytics gives users governed, understandable data products within appropriate permissions. It does not require every employee to understand source-system schemas or recreate business definitions.
5. Compare governance and security using your actual model
Security should be part of the proof of concept, not an implementation task postponed until after selection.
Map representative roles such as board member, CEO, regional manager, finance analyst, sales manager, external partner, and report developer. Test how identity, workspace or project access, row-level restrictions, underlying data access, sharing, export controls, and administrative oversight work for each role.
Pay particular attention to sensitive data. A dashboard may hide compensation, customer information, or personally identifiable information visually while the underlying dataset remains accessible through another route. Security needs to be tested at the data and platform levels.
Governance also includes content lifecycle. Determine how reports move from development to production, how certified assets are identified, how abandoned content is handled, how changes are reviewed, and how usage is monitored.
6. Do not compare license prices in isolation
A low per-user price does not necessarily produce the lowest total cost of ownership.
Build a three-year cost model that includes licenses, capacity or infrastructure where applicable, implementation, data engineering, administration, training, support, migration, monitoring, and expected growth in users and workloads.
Include the cost of maintaining the surrounding data platform. If one option requires substantial additional engineering or a different deployment architecture, include it. If another option lets you reuse existing skills and infrastructure, quantify that advantage rather than assuming it.
Migration cost is especially important. Rebuilding a large estate of dashboards is not a simple file conversion. Calculations, filters, security, interactions, subscriptions, extracts, data sources, and user workflows may need to be recreated and reconciled.
A platform that appears less expensive annually can take years to recover the cost of an unnecessary migration.
7. Test performance with representative data volumes
A proof of concept using a small spreadsheet says little about production performance.
Use datasets that approximate your real row counts, model complexity, concurrency, refresh patterns, and security rules. Test the reports users actually need, including the slow and complicated ones.
Measure initial load time, interaction latency, refresh duration, scheduled workload behavior, and the effect of concurrent usage. Identify whether performance depends on extracts, imported models, direct queries, caching, aggregation, or changes to the underlying warehouse.
Performance problems are often architecture problems rather than visualization-tool problems. Poorly modeled data, inefficient calculations, excessive granularity, and unnecessary queries can make either platform perform badly.
8. Evaluate the skills you have and the skills you can realistically hire
The technically strongest platform on paper may be the wrong platform if the organization cannot operate it effectively.
Inventory existing skills among BI developers, data engineers, analysts, administrators, and business users. Estimate training requirements and identify who will own the platform after the implementation team leaves.
Do not assume that analysts who are comfortable in Excel will immediately become capable BI modelers. Likewise, do not assume a central data team can support unlimited departmental reporting without creating a bottleneck.
Your operating model should clarify who builds governed datasets, who creates enterprise reports, who can create departmental content, who approves access, and who supports users.
9. Consider how analytics will be consumed
Not every user wants to open a BI application every morning.
Determine whether analytics will be consumed in executive meetings, collaboration tools, mobile devices, portals, customer-facing applications, scheduled distributions, operational workflows, or embedded applications. Test the delivery patterns that matter rather than assuming every dashboard will be accessed through the platform’s standard interface.
For embedded or external analytics, evaluate authentication, tenant separation, branding requirements, usage patterns, development effort, and commercial terms carefully. External distribution can materially change architecture and cost.
10. Separate platform selection from data architecture
Power BI or Tableau cannot compensate for fragmented, poorly defined data.
If finance reports revenue from an ERP, sales reports bookings from a CRM, and operations tracks delivery in another application, the BI platform still needs a trustworthy way to combine those sources. Depending on complexity, this might involve a cloud warehouse, transformation pipelines, governed data models, and reconciliation tests.
Avoid forcing all transformation logic into dashboards merely because the BI tool can perform transformations. Reusable, business-critical logic often belongs upstream where it can be tested and shared.
The platform should sit on top of a data architecture appropriate to the organization rather than becoming the data architecture itself.
A practical Power BI vs Tableau decision scorecard
Create a weighted scorecard before the demonstrations. A reasonable starting structure is:
- Business use-case fit: 20%
- Data and semantic modeling: 15%
- Governance and security: 15%
- Existing ecosystem and integration: 15%
- User experience and analytical exploration: 10%
- Performance and scalability: 10%
- Three-year total cost of ownership: 10%
- Skills, administration, and support: 5%
The percentages are not universal. Change them before scoring the products. A highly regulated organization may increase governance weighting. An analytics-heavy organization may increase exploration and modeling. A company distributing analytics to customers may give embedded delivery a separate category.
Score both products against documented evidence from the same use cases. Record assumptions and unresolved issues. The purpose of the scorecard is not mathematical precision. It prevents one impressive feature or one executive preference from dominating the decision without scrutiny.
When Power BI may be the stronger fit
Power BI deserves particularly serious consideration when your organization has extensive Microsoft investments, wants close alignment with a Microsoft-centered data and identity architecture, has a broad population of users already working within that ecosystem, and can benefit from skills or administration that overlap with existing Microsoft capabilities.
It may also be attractive where the organization wants to standardize a fragmented reporting estate and has a clear plan for governed semantic models and controlled self-service.
These are reasons to evaluate it more closely, not guarantees that it will be cheaper or better for every workload.
When Tableau may be the stronger fit
Tableau deserves particularly serious consideration when your organization already has a productive Tableau estate, sophisticated analyst workflows, established governance and skills, or substantial investments in Tableau content that would be expensive to replace.
It can also be compelling where visual analytical exploration is central to the way skilled analysts investigate and communicate data, provided the surrounding governance and data architecture support that operating model.
Again, the existing environment matters. A migration should solve a measurable problem, not simply follow a market trend.
Should you run both Power BI and Tableau?
Sometimes. Large organizations often arrive at multiple BI platforms through acquisitions, departmental choices, or specialized needs. Running both is not automatically wrong, but it creates costs in licensing, administration, training, governance, and duplicated content.
If both remain, define boundaries. For example, one platform might be the standard for enterprise reporting while another supports an established specialist community. More importantly, keep core metric definitions and governed data products consistent so that two visualization tools do not become two versions of the business.
If consolidation is the goal, quantify the benefit before beginning a migration. Eliminating a platform can reduce complexity, but rebuilding hundreds of working reports may cost more than the savings unless the migration also fixes meaningful governance, usability, or operating problems.
A sensible proof-of-concept process
Use a short, controlled evaluation rather than an open-ended tool trial.
First, agree the scorecard and decision owners. Second, choose three to five representative use cases, including at least one difficult report. Third, use realistic data volumes and security. Fourth, have your own analysts and developers participate rather than relying entirely on vendor-built demonstrations. Fifth, estimate production architecture and three-year cost. Finally, document why the winning platform scored better and which risks remain.
The output should be a platform decision plus an implementation plan, not simply a winner.
Frequently asked questions
Is Power BI better than Tableau?
There is no universal winner. Power BI may fit particularly well in Microsoft-centered environments, while Tableau may fit organizations with established Tableau capabilities or strong exploratory analytics workflows. The correct choice depends on use cases, architecture, governance, skills, deployment, and total cost.
Is Power BI cheaper than Tableau?
A license comparison alone cannot answer this reliably. Pricing models, user roles, capacity, deployment choices, external distribution, infrastructure, administration, and migration can all affect total cost. Compare a realistic multi-year scenario for your organization.
Which is easier for business users?
Ease depends on what the user is trying to do. Consuming a governed dashboard, building a departmental report, modeling complex data, and performing exploratory analysis are different tasks. Test each platform with representative internal users and real workflows.
Can Power BI and Tableau connect to the same data warehouse?
Yes. Organizations can use either platform with common enterprise data platforms. The more important question is whether the underlying models, permissions, performance, and business definitions have been designed appropriately for the reporting workload.
Should we migrate from Tableau to Power BI because we already use Microsoft?
Not automatically. Microsoft alignment can be an important advantage, but calculate the cost and risk of rebuilding existing Tableau assets. A migration should have measurable benefits in cost, governance, user experience, administration, or strategic architecture that justify the effort.
Should we migrate from Power BI to Tableau for better visualization?
Not based on visualization preference alone. Identify specific analytical requirements that the current environment cannot meet, test those requirements, and compare the benefit against migration and operating cost.
Do we need a data warehouse before implementing either platform?
Not necessarily. Simpler reporting can work directly with operational systems or existing analytical sources. A warehouse becomes more valuable when several systems need repeatable integration, historical data must be retained, business logic must be reused, or analytical workloads need to be managed independently.
What matters more, the BI tool or the data model?
For many enterprise reporting problems, the quality of the data model, metric definitions, governance, and operating process matters more than the visualization product. Either platform can produce inconsistent reporting when it sits on poorly governed data.
How should executives make the final decision?
Require a documented scorecard, production-level cost estimate, security assessment, representative proof of concept, and clear operating model. The final decision should explain not only which product won, but why it fits the organization and what must be done to implement it successfully.
Conclusion: Choose the operating model, then choose the platform
Power BI versus Tableau is an important technology decision, but the technology should not be evaluated in isolation. Start with the decisions your organization needs to improve, the users who need analytics, the data architecture beneath the reports, and the governance model that will keep metrics trustworthy.
Then test both platforms against those requirements. Include real data, real users, realistic security, and the full cost of operating the environment. Preserve the value of existing assets unless migration solves a problem worth paying to solve.
A successful BI platform selection is not the one that wins the longest feature checklist. It is the one your organization can govern, operate, adopt, and use to make better decisions over time.
About Actiknow
Actiknow Consulting helps organizations design and implement business intelligence and data solutions across platforms including Power BI, Tableau, Snowflake, BigQuery, Salesforce, and modern data integration stacks. We work across data engineering, analytics architecture, dashboard development, and reporting modernization.
If you are evaluating Power BI and Tableau, Actiknow can help structure the decision around your actual data, users, security requirements, existing technology, and total cost rather than a generic feature comparison. A focused assessment or proof of concept can make the tradeoffs visible before you commit to a broader implementation.