

“Can the dashboard be real time?”
It is one of the most common requests in analytics projects.
It is also usually the wrong starting point.
An executive dashboard does not need the freshest technically possible data. It needs data fresh enough for the decisions the dashboard supports.
A board-level financial view may be perfectly useful with daily data.
A marketing pacing dashboard may need hourly updates.
A fraud or operational control dashboard may need changes within minutes.
The right requirement is not “real time.”
It is a measurable data freshness service level agreement.
What Is a Dashboard Data Freshness SLA?
A dashboard data freshness SLA defines how current the data is expected to be and what happens when that expectation is not met.
A useful SLA answers:
- How old can the data be?
- When does the SLA apply?
- How is freshness measured?
- Which data sources are covered?
- What happens when a pipeline fails?
- How quickly must service recover?
- Who owns the response?
- When are users notified?
This turns an informal expectation into an operating commitment.
Actiknow’s business intelligence services cover data engineering, cloud warehouses and executive reporting. Freshness should be designed across that entire pipeline rather than treated as a dashboard refresh setting.
Start With the Decision
Ask what decision the dashboard supports.
Then ask how quickly the underlying facts can change enough to alter that decision.
Examples:
1. Board Reporting
If executives review monthly financial performance, sub-minute freshness creates little additional value.
2. Daily or scheduled close-cycle updates may be sufficient.
3. Sales Management
A sales leader monitoring pipeline and daily bookings may need hourly or several-times-daily updates.
4. Call Center Operations
A supervisor managing active queues may need minute-level information.
5. Marketing Campaign Pacing
Teams managing large daily spend may need updates frequently enough to adjust budget before significant overspend occurs.
The SLA should follow the decision cadence.
Define Freshness as a Number
Avoid terms such as:
- Live.
- Real time.
- Near real time.
- Frequently.
- Current.
- Up to date.
Replace them with measurable language.
For example:
During business hours, 95% of dashboard data should reflect source-system changes within 30 minutes.
Or:
The executive revenue dashboard should contain source data through 11:59 PM of the previous day by 7:00 AM each business day.
Now engineering can design and test against the requirement.
Measure End-to-End Freshness
Dashboard freshness is not just BI refresh frequency.
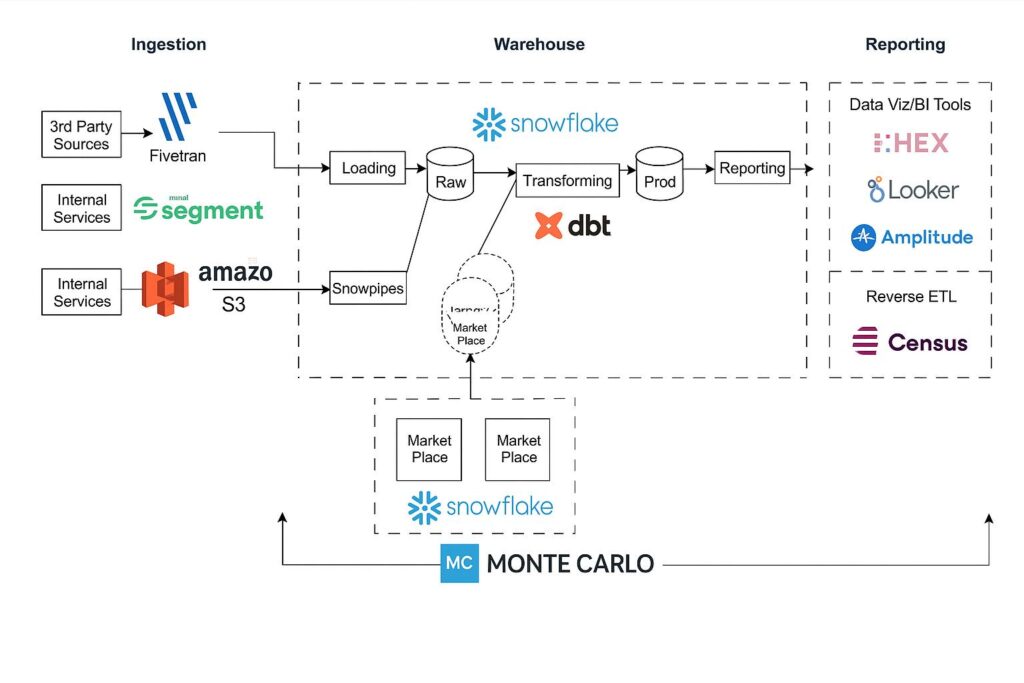
Data may travel through several stages:
- Source system.
- Connector.
- Landing layer.
- Transformation.
- Warehouse mart.
- Semantic model.
- Dashboard.
A dashboard can refresh every fifteen minutes and still show three-hour-old data if the upstream pipeline is delayed.
Measure end-to-end latency from the relevant source event to report availability.
Separate Source Availability From Pipeline Latency
Sometimes the source itself does not provide immediate data.
For example:
- A vendor API may update hourly.
- A partner may deliver a file each morning.
- An advertising platform may revise attribution after initial reporting.
- A finance system may post only after batch close.
The SLA cannot promise freshness that the source cannot provide.
Document source availability separately.
Example:
Source availability: vendor typically exposes data within 60 minutes.
Internal processing target: data appears in dashboard within 15 minutes of source availability.
This makes responsibility clear.
Define the Freshness Clock
What starts the SLA timer?
Possible definitions include:
- Transaction committed in source.
- Source API exposes the record.
- File arrives.
- Warehouse ingestion completes.
- Business process closes.
Choose the event that reflects the actual commitment.
For third-party sources, measuring from “transaction occurred” may be impossible if the vendor does not expose when the event became available.
Use a measurable boundary.
Define the Coverage Window
Not every dashboard needs the same SLA 24/7.
Examples:
- Business hours only.
- Weekdays.
- Month-end close.
- Campaign launch periods.
- 24/7 operations.
A daily executive dashboard may have a strict 7:00 AM deadline but no meaningful freshness requirement overnight.
A control dashboard may need continuous coverage.
The SLA should match the operating model.
Use Different SLAs for Different Data Domains
One dashboard can combine sources with different availability.
For example:
- Salesforce every 30 minutes.
- ERP daily.
- Web analytics hourly.
- Finance after nightly close.
Do not hide this complexity behind one generic “last refreshed” timestamp.
Define freshness expectations by source or metric group when needed.
Then make the dashboard transparent about differences.
Show Data Freshness to Users
Executives should not need to ask whether a number is current.
Useful indicators include:
- Data through: 10:30 AM.
- Last successful refresh: 10:42 AM.
- Source delayed.
- Partial data.
- Refresh failed.
For multi-source dashboards, one timestamp may be misleading.
Consider showing freshness for critical source groups or clearly flagging stale sections.
Freshness Is Different From Refresh Success
A pipeline can complete successfully and still produce stale data.
Examples:
- Source file did not arrive.
- API returned yesterday’s data.
- Upstream job stopped updating a table.
- Watermark logic skipped new records.
- Connector credentials changed and a source silently stopped.
Monitor the age of the data itself, not only job status.
Define a Freshness Metric
A simple metric is:
Freshness latency = dashboard availability time minus source availability time
For scheduled daily reporting, use a deadline metric.
Example:
Percentage of business days when the dashboard is complete by 7:00 AM.
For streaming or frequent pipelines, use percentile-based latency.
Example:
95% of eligible records available within 20 minutes.
99% within 45 minutes.
Percentiles are often more useful than averages because a few severely delayed loads can matter.
Define SLO, SLA and Internal Targets Carefully
Organizations use these terms differently.
A practical approach is:
- Business SLA: the commitment to dashboard consumers.
- Engineering SLO: the operational target designed to meet the SLA.
- Internal warning threshold: an earlier threshold that triggers investigation before the SLA is breached.
Example:
- Business SLA: dashboard ready by 7:00 AM.
- Engineering SLO: pipeline complete by 6:30 AM.
- Warning threshold: transformation not complete by 6:15 AM.
This creates recovery time before users are affected.
Include Recovery Time
Freshness SLAs need failure recovery.
Define:
- How quickly is a failed job detected?
- How quickly does investigation begin?
- How long can recovery take?
- What is the escalation path?
- When are users informed?
For example:
A failed executive-dashboard refresh must alert the data team within five minutes. Recovery begins within fifteen minutes. If data will miss the 7:00 AM SLA, dashboard owners are notified by 6:45 AM.
The exact times depend on business importance.
Define Maximum Tolerable Staleness
A dashboard may remain usable when slightly stale.
At some point, it becomes unsafe or misleading.
Define that point.
Example:
- Up to 30 minutes late: show warning.
- More than two hours late: prominently mark dashboard stale.
- More than four hours late: disable specific operational recommendations or escalate.
For critical decisions, hiding stale data may be safer than presenting it without warning.
Do Not Use the Same SLA for Every Dashboard
Freshness has cost.
More frequent processing can increase:
- Warehouse compute.
- API usage.
- Gateway load.
- Power BI refresh operations.
- Infrastructure.
- Monitoring.
- Support.
- Engineering complexity.
Set stronger SLAs only where business value justifies them.
A CEO dashboard and a warehouse control screen may need very different architectures.

Match Architecture to Freshness
Different freshness requirements imply different designs.
1. Daily
Scheduled batch pipelines and Import models may be sufficient.
2. Hourly
Incremental ingestion and scheduled semantic-model refresh may work well.
3. Minutes
More frequent ingestion, efficient incremental processing and DirectQuery or other low-latency serving patterns may be appropriate.
4. Seconds
Streaming or operational analytics architecture may be required.
Do not force a daily batch architecture to behave like a streaming platform.
Likewise, do not build streaming infrastructure for a monthly management report.
Account for BI Refresh Limits and Behavior
Power BI architecture affects achievable freshness.
Import models depend on refresh.
Incremental refresh can reduce processing time.
DirectQuery queries the source during report interactions.
Hybrid models can combine imported history with fresher recent data.
Gateway-connected sources add another operational dependency.
Choose storage and refresh architecture after the SLA is defined.
Account for Warehouse Pipeline Behavior
Modern cloud warehouses can support frequent transformations, but each pattern has operational characteristics.
For example, Snowflake supports mechanisms such as streams, tasks and dynamic tables for incremental or freshness-driven processing.
The important architecture question is not which feature is newest.
It is whether the pipeline can reliably meet the target latency with understandable cost and recovery behavior.
Define Ownership by Layer
A dashboard freshness incident can cross several teams.
Assign ownership.
1. Source owner
Responsible for source availability and source-system issues.
2. Ingestion owner
Responsible for connectors, files, APIs and landing.
3. Transformation owner
Responsible for warehouse models and data quality.
4. BI owner
Responsible for semantic models and dashboard refresh.
5. Infrastructure owner
Responsible for gateways, networks and platform services.
6. Business owner
Defines acceptable freshness and receives escalation.
Without this map, incidents become long conversations about whose system is failing.
Create a Freshness Dependency Map
For each critical dashboard, document:
- Source.
- Expected source availability.
- Ingestion job.
- Transformation job.
- Semantic model.
- Dashboard.
- Expected completion.
- Owner.
- Alert.
- Recovery procedure.
This makes the SLA operational.
It also reveals when one dashboard depends on ten separate jobs with no coordinated schedule.
Monitor Each Stage
Track timestamps through the pipeline.
Examples:
- Latest source record time.
- Latest ingestion time.
- Latest transformed record time.
- Semantic-model refresh time.
- Dashboard availability time.
If the dashboard becomes stale, these timestamps identify where latency accumulated.
This is far better than a single “refresh failed” alert.
Monitor Data Volume Too
A pipeline can appear fresh while loading incomplete data.
Track expected volume where appropriate.
Examples:
- Daily rows.
- Files received.
- Transactions.
- Accounts processed.
- API pages.
- Partitions loaded.
Compare against historical ranges.
A load finishing on time with 20% of normal volume may be a data-quality incident, not an SLA success.
Handle Partial Freshness
Multi-source dashboards may be partially current.
Decide how the product should behave.
Options include:
- Show source-level timestamps.
- Flag affected visuals.
- Hide incomplete metrics.
- Show a warning banner.
- Delay the complete dashboard.
The right choice depends on whether partial information is useful or misleading.
Plan for Backfills and Corrections
Freshness focuses on recent data, but historical accuracy matters too.
Sources can revise previous periods.
Define how corrections are handled.
Examples:
- Refresh last seven days every run.
- Reprocess previous month nightly.
- Run targeted backfills when reconciliation detects a difference.
- Use source modification timestamps.
Fresh data that contains uncorrected history is not necessarily trustworthy data.
Include Data Quality in the SLA Conversation
A dashboard updated every five minutes with incorrect data is not better than a correct dashboard updated hourly.
Balance:
- Freshness.
- Completeness.
- Accuracy.
- Consistency.
- Availability.
For executive reporting, accuracy and consistency may be more important than reducing latency from thirty minutes to five.

Create an Escalation Matrix
Define severity levels.
Example:
1. Severity 1
Critical executive or operational dashboard unavailable or materially stale beyond maximum tolerance.
2. Severity 2
SLA at risk, partial source delay or degraded refresh.
3. Severity 3
Non-critical delay with workaround available.
For each severity, define:
- Response time.
- Owner.
- Escalation.
- Communication channel.
- Update frequency.
This prevents every failed refresh from being treated as either trivial or catastrophic.
Measure SLA Attainment
Track whether the service actually meets the commitment.
Useful metrics include:
- Percentage of refreshes within SLA.
- Percentage of days dashboard ready by deadline.
- 95th percentile freshness latency.
- Number of stale-data incidents.
- Mean time to detect.
- Mean time to recover.
- Repeated failures by source.
Freshness should become an operational KPI for important dashboards.
Review the SLA Periodically
Business needs change.
A dashboard originally used for monthly review may become part of daily operations.
Or a supposedly critical hourly dashboard may receive little usage.
Review:
- Usage.
- Decision cadence.
- Incident history.
- Cost.
- Source limitations.
- Business value.
Increase or relax the SLA based on evidence.
A Dashboard Freshness SLA Template
Use a simple structure.
- Dashboard: Executive Sales Performance
- Business owner: VP Sales
- Technical owner: Data & BI Team
- Coverage: Monday to Friday, 6:00 AM to 8:00 PM
- Source availability: CRM changes normally available within 5 minutes
- Freshness SLA: 95% of eligible source changes visible within 30 minutes
- Maximum staleness: 60 minutes
- Warning threshold: 20 minutes
- Critical threshold: 60 minutes
- Detection: Automated freshness monitor every 5 minutes
- Recovery target: Investigation begins within 15 minutes
- Escalation: Business owner notified when critical threshold is breached
- User communication: Dashboard warning displayed while data is outside SLA
- Measurement: Monthly SLA attainment and 95th percentile latency
The exact format can be adapted, but every field should have an owner and measurable definition.

Questions to Ask Before Promising “Real Time”
- What decision changes if data is five minutes fresher?
- How quickly does the source expose changes?
- What is the maximum acceptable staleness?
- Does the SLA apply 24/7?
- Which metrics need the strongest freshness?
- Can some sources be slower?
- How will users know when data is stale?
- What happens when a pipeline fails?
- Who owns recovery?
- What will the lower-latency architecture cost?
- How will historical corrections be handled?
- How will SLA attainment be measured?

Frequently Asked Questions
What is a dashboard data freshness SLA?
It is a measurable commitment defining how current dashboard data should be, when the commitment applies, how freshness is measured and what happens when the target is missed.
Is data freshness the same as refresh frequency?
No. A dashboard can refresh frequently while upstream data is stale. Freshness should be measured end to end from an appropriate source-availability point to report availability.
Should executive dashboards be real time?
Only if the decisions require it. Many executive decisions work well with hourly or daily data. Lower latency adds cost and operational complexity, so define the business requirement first.
How should freshness be displayed in a dashboard?
Show a clear “data through” or last-successful-refresh indicator. For multi-source dashboards, source-level freshness or stale-section warnings may be more accurate than one global timestamp.
What happens if a freshness SLA is missed?
The operating process should detect the breach, alert the responsible team, attempt recovery, escalate according to severity and inform users when the data is materially stale.
Can Power BI support near-real-time dashboards?
Power BI provides several architectures, including DirectQuery and hybrid patterns, that can support lower-latency scenarios. The complete source, network, gateway, semantic-model and capacity architecture must still meet the target.
How do you measure freshness when a third-party API is delayed?
Separate vendor availability from internal processing. Measure internal latency from the point at which the vendor makes data available, while also tracking vendor delay as a dependency.
Should every dashboard have an SLA?
Not necessarily a formal contractual SLA, but important dashboards should have explicit freshness expectations, ownership and failure procedures.
Conclusion
Data freshness should be a business requirement with an engineering definition.
Start with the decision. Define how old the data can be. Identify when the clock starts. Measure the complete pipeline. Set recovery and escalation expectations. Show freshness clearly to users.
Then choose the architecture.
A precise 30-minute SLA is far more useful than a vague request for “real-time dashboards.”
It gives data engineering, BI, infrastructure and business teams a shared target they can design, monitor and improve.
If your executive dashboards have unclear or unreliable freshness, Actiknow can help map the source-to-dashboard pipeline, define measurable freshness targets and design the data architecture required to meet them. Discuss your BI and data engineering requirements with Actiknow.